AbstractPurposeThe purpose of this study was to assess tumor angiogenesis using contrast-enhanced ultrasonography (CEUS) of human prostate cancer cells (PC3) that were implanted in mice before and after paclitaxel injection.
MethodsTwelve mice were injected with human PC3. The mice were grouped into two groups; one was the paclitaxel-treated group (n=6) and the other was the control group (n=6). Before administering paclitaxel into the peritoneal cavity, baseline CEUS was performed after the administration of 500 ╬╝L (1├Ś108 microbubbles) of contrast agent. The area under the curve (AUC) up to 50 seconds after injection was derived from the time-intensity curves. After injection of paclitaxel or saline, CEUS studies were performed at the 1-week follow-up. Changes in tumor volume and the AUC in both two groups were evaluated. After CEUS, the microvessel density (MVD) was compared between the groups.
ResultsIn the paclitaxel-treated group, the AUC from CEUS showed a significant decrease 1-week after paclitaxel administration (P=0.030), even though the tumor volume showed no significant changes (P=0.116). In the control group, there was no significant decrease of the AUC (P=0.173). Pathologically, there was a significant difference in MVD between both groups (P=0.002).
Ultrasound contrast agents (UCAs), commonly referred to as microbubbles, have an approximate size of 1 to 7 ╬╝L and comprise an outer shell and inner gas [1,2]. The outer shell is made of denatured albumin or phospholipids with a thickness of about 20 to 200 nm, while perfluropropane or sulfur hexafluorane gas with a high molecular weight and low solubility is commonly used as the inner gas [3]. Although there have been cases of injection of UCAs into the bladder for assessing ureteral reflux or into the fallopian tube to detect blockage, UCAs are most often used via intravenous injection. Microbubbles, which are UCAs, are similar in size to red blood cells and they remain in the blood vessels without spreading to nearby tissues, and thus, they are also referred to as blood-pool agents.
Ultrasonography technology, which has undergone rapid advancement in recent times, has shown improved a tissue contrast ratio. Microbubbles show a signal enhancement effect from the nonlinear response to ultrasonic energy and such nonlinear response gives a clearer view of images in various imaging modes, such as harmonic imaging and pulse inversion modes, where these types of imaging technology are collectively referred to as contrast-specific imaging mode [4].
Angiogenesis, the phenomenon of producing new blood vessels, is a physiological response that occurs in tissue in response to development, reproduction, wound healing, or ischemia [5]. However, angiogenesis is a process that is also required in the formation and metastasis of tumors that have physiological abnormalities, while microvessel density (MVD), which refers to the degree of new blood vessel formation, has been found to be associated with angiogenesis in various types of tumors [5,6].
The characteristic of UCAs is their size that reaches several micrometers, and they remain in the blood vessels, which allow imaging of angiogenesis. Therefore, it is believed that by utilizing such characteristics, UCAs can serve as an objective radiologic index for analyzing the angiogenesis-inhibiting effects of anti-cancer drugs and enable the assessment of such responses.
Accordingly, the aim of the present study was to administer paclitaxel, an anti-cancer drug, in a xenograft mouse tumor model that was created using the PC3 cell line, a prostate cancer cell line, and assess the radiologic role of UCA in the evaluation of angiogenesis before and after drug administration.
Twelve male nude mice, approximately 6 to 7 weeks old (Orient, Seoul, Korea), were procured and reared in a specific-pathogenfree environment in a preclinical trial laboratory. The nude mice were reared in a controllable environment (12-hour day-night shift, temperature of 20┬░C-24.8┬░C) where they could be fed sterile food.
The PC3 cell line, a prostate cancer cell line, was procured from the Korea Cell Line Bank (KCLB, Seoul, Korea). The cells were cultured in 5% carbon dioxide, humid environment, with a temperature of 37┬░C, in RPMI 1640 medium (Sigma-Aldrich, St. Louis, MO, USA), with mixture of 10% fetal bovine serum (FBS) and penicillin-streptomycin.
To create the tumor model, 0.2 mL of FBS mixed with approximately 1.5├Ś106 cells was injected subcutaneously into the hind leg muscle of each nude mouse. Tumors were allowed to develop for 4-6 weeks after the injection until the tumor size reached about 5-15 mm (Fig. 1). The mean and standard deviation of the maximum tumor diameter was 1.2┬▒0.3 cm (range, 0.7 to 1.7 cm). The protocol used for all animals was approved by the Institutional Animal Care and Use Committee of our research institution.
The animal tumor models that had been created were randomly divided into two groups, six animals were allocated to the anticancer drug administration (experimental) group and six to the control group. The mean weight of mice in the experimental and control groups was 26.1┬▒3.2 g and 27.6┬▒4.2 g, respectively. The experimental group received an intraperitoneal injection of 10 mg/kg of paclitaxel (Taxol, Mead Johnson, Evansville, IN, USA), the anti-cancer drug, while the control group received an intraperitoneal injection of same dose of saline instead of paclitaxel. Ultrasonography with UCA, or contrast-enhanced ultrasonography (CEUS), was performed for up to 1 week after the intraperitoneal injection.
A radiology specialist (S.I.H.) with approximately 13 years of ultrasonography experience performed all of the CEUS examinations. CEUS was performed on both the experimental and control groups prior to the anti-cancer drug or saline injections, as well as 1 week after the drug or saline injections. CEUS was performed using a 5-12 MHz broadband linear transducer (Philips, Bothell, WA, USA) and iU22 ultrasound scanner (Philips).
Prior to CEUS, tumor size was measured in three axes in images from regular ultrasonographs and the formula, 0.5├Śa├Śb├Śc, was used to calculate the tumor volume (Fig. 2). The UCA used was a commercially available UCA for clinical use (SonoVue, Bracco, Milan, Italy). An intravenous bolus injection of 500 ╬╝L of UCA was used to acquire the CEUS. The ultrasonographs were acquired with a mechanical index of 0.07, using the pulse inversion harmonic imaging mode (Fig. 3).
All CEUS images were saved in a computer and data from the images were obtained using a sonographic image analysis software (Qlab, Philips). The radiology specialist designated the region of interest of the images and the time-intensity curve of that region was constructed (Fig. 4). For quantitative analysis of the timeintensity curve, the time-intensity curve for the start of the ultrasonic analysis to 50 seconds afterwards was drawn, and the area under the curve (AUC) was then measured.
Immediately after acquiring the CEUS images at 1 week after anticancer drug or saline injection, the animals were euthanized using carbon dioxide. The tumor in each animal was harvested and fixed with formalin, after which immunohistochemical staining for CD31 was performed to analyze MVD. The section obtained from a paraffin block was boiled in 0.01% sodium citrate buffer (pH 6.0) and treated with 3% hydrogen peroxidase solution to prevent internal activation of peroxidase. The tissue section was stained for CD31 using a polymerization method (DAKO Real EnVision Detection System, Glostrup, Denmark) using an anti-CD31 monoclonal antibody (sc-1506r, Santa Cruz Biotechnology Inc., Santa Cruz, CA, USA).
MVD was measured by selecting the slide that showed the largest area for each tumor and counting the number of microvessels stained by CD31 under an optical microscope at 200├Ś magnification. This process was repeated 5 times and the mean value was obtained. Immunohistochemical staining and analysis of the results were performed by a doctor of pathology with 8 years of experience (H.S.J.).
The AUC of the time-intensity curve and tumor volume before the injection and 1 week after injection were measured in both the experimental and control groups, and the Wilcoxon signed-rank test was performed to determine whether such changes were statistically significant. In addition, the Mann-Whitney test was performed to examine the differences in MVD values between the experimental and control groups. For all statistical analyses, the significance level was set to <0.05.
The results of tumor volume and AUC of the time-intensity curve in CEUS images before anti-cancer drug or saline injection and 1 week after injection for both the experimental and control groups are shown in Table 1. In the experimental group, tumor volume did not show significant changes after anti-cancer drug injection (P=0.116), but AUC of the time-intensity curve in CEUS images showed a statistically significant decrease (P=0.030) (Fig. 5). However, in the control group, tumor volume showed a statistically significant increase (P=0.028), but AUC of the time-intensity curve in CEUS images did not show any statistically significant difference (P=0.173) (Fig. 6).
Angiogenesis refers to the mechanism involving the generation of new microvessels from existing blood vessels. Besides normal generation, it is also an essential process for supplying nutrients and oxygen and eliminating waste under various physiological conditions, such as wound healing and diabetic retinopathy, as well as growth, infiltration, and metastasis of tumors [5,7,8]. Because angiogenesis plays an important role in tumor growth and metastasis, it can be a very meaningful target in the treatment and imaging of tumors [5,9].
For in vivo imaging experiments on angiogenesis, it is a common practice to culture cancer cells and transplant them into a specific animal, such as a nude mouse, to create an animal model before the main experiment. The present study used the PC3 cell line, a typical prostate cancer cell line, and created a xenograft animal model by subcutaneous injection of the cell line into nude mice. However, despite the advantages of these xenograft animal models, namely, the ease of creating tumor models and identifying tumor growth, the fact that the tumor is a xenograft-derived tumor from an immunosuppressed animal makes it difficult to fully represent the traits of the original tumor. To overcome these shortcomings, transgenic models are also being used.
To understand the pathophysiology of angiogenesis and develop the technology to control it requires methods for accurately quantifying the degree of angiogenesis. Depending on the stage of angiogenesis, the indicators of vascular density, blood flow or metabolic pattern, and vascular endothelial cell activation and proliferation in the lesion, as well as clinical findings or symptoms may be used [10]. Currently, the quantitative method most commonly used is measuring MVD by immunohistochemical staining of vascular endothelial cell antigens, such as CD31, but this method has the disadvantages of large sampling error and inter-examiner error, which highlights the need for the development of more objective and accurate imaging technology.
On the strength of recent advances in UCAs, quantification of angiogenesis using UCA and imaging based on target-specific UCA have received much attention for their noninvasive assessment of tumor angiogenesis at the molecular level [11].
In particular, the advantages of ultrasonic molecular imaging over other molecular imaging methods include the fact that it has higher temporal and spatial resolution, is noninvasive, provides realtime images, has relatively lower cost, and does not use radiation. Owing to these advantages, ultrasonography is expected to make significant contributions to tumor imaging and in pre-clinical trials on the development of various novel drugs, while its future clinical utilization is expected to increase as well.
Paclitaxel is an anti-cancer drug used in ovarian, prostate, and bladder cancer cases, which is known to play a role in inhibiting angiogenesis and preventing tumor cell proliferation by inhibiting cell differentiation [12]. The present study is significant because it revealed the possibility that if novel anti-cancer drugs are assessed using CEUS to analyze their effects, follow-up examinations using images can be performed as in actual clinical settings, while minimizing the number of animals sacrificed.
In the present study, despite the fact that the experiment group did not show any changes in tumor volume, it showed a statistically significant decrease in AUC in the CEUS, and pathologically it showed a decrease in microvessels compared with the control group. Therefore, it is believed that the degree of angiogenesis had already been mitigated before the actual tumor volume decreased, and such effects on angiogenesis can be detected using CEUS. On the other hand, the control group did not show any changes in AUC in the CEUS, which supports the possibility mentioned above.
The future prospects of UCAs are very bright from various viewpoints. Recently, Pysz et al. [2] reported the use of CEUS to assess and monitor tumor vascularity, while Deshpande et al. [13] attempted to assess angiogenesis markers that are expressed during tumor growth by targeted microbubbles and ultrasonographs. Willmann et al. [14] injected mouse tumor models with microbubbles containing antibodies that can track vascular endothelial growth factor receptor 2 and microbubbles without such antibodies to analyze the in vivo tracking effects; CEUS examination of tumor showed a statistically significant increase in density of the microbubbles with antibodies attached compared with the ones without. In the study by Ellegala et al. [15], angiogenesis of the tumor was discovered by attaching ╬▒v-integrin antibody to microbubbles, as ╬▒v-integrin is expressed in the vascular endothelial cells newly formed by the tumor. The study also reported that such technology can provide information on tumor volume and growth speed and is expected to provide biological information on tumor vascularity [15]. As reported by various researchers in their studies, it is expected that UCAs will be used in various methods and will play various roles in the imaging of vascularity or angiogenesis factors of tumors.
The present study had several limitations. First, the study obtained only short-term follow-up results before anti-cancer drug injection to 1 week after injection. The reason why only short-term follow-up results were obtained can be attributed to unfamiliarity in dealing with tumor in or performing tests on nude mice. A long-term study is needed in the future after accumulation of technical experience and improvement in problematic areas. Second, the number of animals used was too low for parametric statistical analysis. However, this limitation involves a decision that must consider whether to increase the number of experimental animals for parametric statistical analysis versus the ethical consideration that an animal study should strive to sacrifice a minimum number of animals. Third, due to technical difficulties involved in intravenous injection into nude mice, the present study performed intraperitoneal injection of paclitaxel instead of intravenous injection, which is the more common method of paclitaxel injection in clinical settings. However, intraperitoneal injection of paclitaxel in animal prostate cancer models has already been introduced; thus, such difference in injection method is believed to have had little impact on the findings of the present study [16,17].
We believe that despite these limitations, the present study is significant because it used a tumor cell line in establishing a prostate cancer model in live animals and the tumor model was injected with an anti-cancer drug for comparative analysis of CEUS images before and after the anti-cancer drug injection to analyze the inhibition of angiogenesis by the anti-cancer drug. Moreover, the fact that changes in CEUS images can be seen prior to any changes in tumor size is significant in molecular imaging. In the future, various imaging techniques are expected to play a role as imaging biomarkers of drug effects in the development of novel anti-cancer drugs. Among those techniques, CEUS has the advantages of being safe, noninvasive, and repeatable, as well as enabling follow-up examinations for each individual. Therefore, we believe that CEUS has limitless potential for use in the clinical fields, as well as in molecular imaging.
Conflict of InterestHak Jong Lee is the co-founder of IMGT Co. Ltd. All remaining authors have declared no conflicts of interest. AcknowledgementsThis work was supported by the Korea Research Foundation Grant funded by the Korean Government (MOEHRD) - (KRF-2008-314-E00164).
References1. Burns PN, Wilson SR. Microbubble contrast for radiological imaging: 1. Principles. Ultrasound Q 2006;22:5ŌĆō13.
2. Pysz MA, Foygel K, Panje CM, Needles A, Tian L, Willmann JK. Assessment and monitoring tumor vascularity with contrastenhanced ultrasound maximum intensity persistence imaging. Invest Radiol 2011;46:187ŌĆō195.
3. Quaia E. Physical basis and principles of action of microbubblebased contrast agents. In: Quaia E, ed. Contrast media in ultrasonography. Berlin: Springer, 2005:15ŌĆō30.
5. Folkman J. What is the evidence that tumors are angiogenesis dependent? J Natl Cancer Inst 1990;82:4ŌĆō6.
6. Pysz MA, Foygel K, Rosenberg J, Gambhir SS, Schneider M, Willmann JK. Antiangiogenic cancer therapy: monitoring with molecular US and a clinically translatable contrast agent (BR55). Radiology 2010;256:519ŌĆō527.
7. Li WW. Tumor angiogenesis: molecular pathology, therapeutic targeting, and imaging. Acad Radiol 2000;7:800ŌĆō811.
8. McDonald DM, Choyke PL. Imaging of angiogenesis: from microscope to clinic. Nat Med 2003;9:713ŌĆō725.
9. Boehm T, Folkman J, Browder T, O'Reilly MS. Antiangiogenic therapy of experimental cancer does not induce acquired drug resistance. Nature 1997;390:404ŌĆō407.
11. Deshpande N, Pysz MA, Willmann JK. Molecular ultrasound assessment of tumor angiogenesis. Angiogenesis 2010;13:175ŌĆō188.
12. Unger EC, McCreery TP, Sweitzer RH, Caldwell VE, Wu Y. Acoustically active lipospheres containing paclitaxel: a new therapeutic ultrasound contrast agent. Invest Radiol 1998;33:886ŌĆō892.
13. Deshpande N, Ren Y, Foygel K, Rosenberg J, Willmann JK. Tumor angiogenic marker expression levels during tumor growth: longitudinal assessment with molecularly targeted microbubbles and US imaging. Radiology 2011;258:804ŌĆō811.
14. Willmann JK, Paulmurugan R, Chen K, Gheysens O, Rodriguez-Porcel M, Lutz AM, et al. US imaging of tumor angiogenesis with microbubbles targeted to vascular endothelial growth factor receptor type 2 in mice. Radiology 2008;246:508ŌĆō518.
15. Ellegala DB, Leong-Poi H, Carpenter JE, Klibanov AL, Kaul S, Shaffrey ME, et al. Imaging tumor angiogenesis with contrast ultrasound and microbubbles targeted to alpha(v)beta3. Circulation 2003;108:336ŌĆō341.
16. Zheng X, Chang RL, Cui XX, Avila GE, Hebbar V, Garzotto M, et al. Effects of 12-O-tetradecanoylphorbol-13-acetate (TPA) in combination with paclitaxel (Taxol) on prostate Cancer LNCaP cells cultured in vitro or grown as xenograft tumors in immunodeficient mice. Clin Cancer Res 2006;12(11 Pt 1):3444ŌĆō3451.
Photograph of the xenograft animal model of prostate cancer.The photograph shows a mouse with a 0.8-cm tumor on his back. This tumor developed after an injection of PC3 cells (arrows).
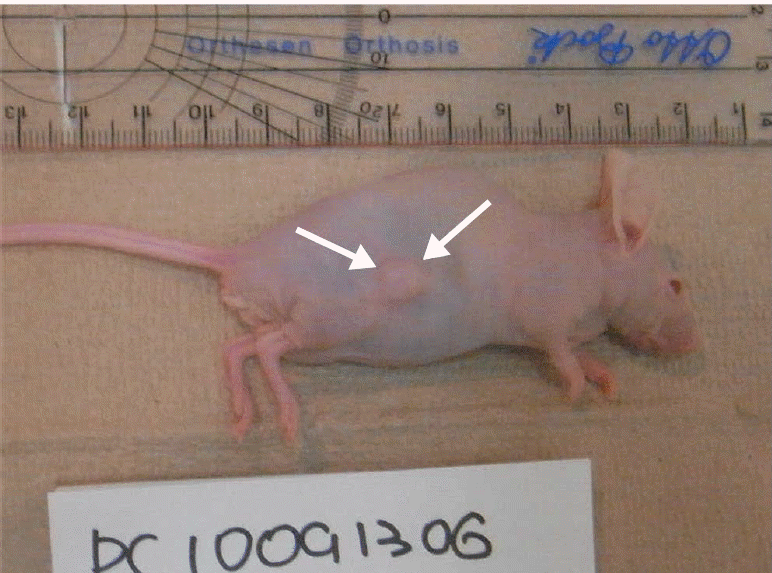 Fig.┬Ā1.Ultrasonography (US) of a xenograft tumor model. USUS with a high MHz linear probe shows a homogenous low echoic mass in the mouse. This mass shows homogenous low echogenicity, suggesting that this tumor is a solid mass (arrows).
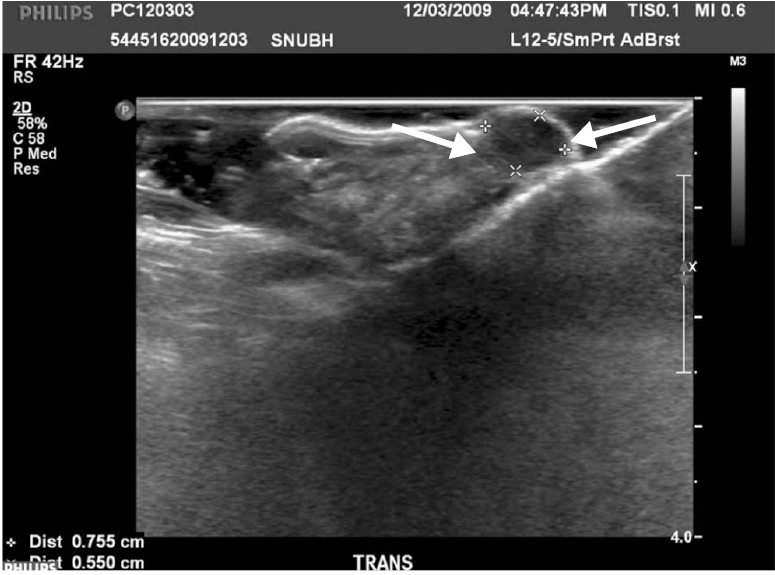 Fig.┬Ā2.Contrast-enhanced ultrasonographic (CEUS) findings of the early (A) and delayed (B) phases.A. CEUS immediately after injection of contrast (3 seconds later) shows a peripheral enhancing lesion in the tumor (arrows). B. Delayed phase CEUS (20 seconds after contrast injection) shows global enhancement of the mass that suggests a hypervascular mass (arrows).
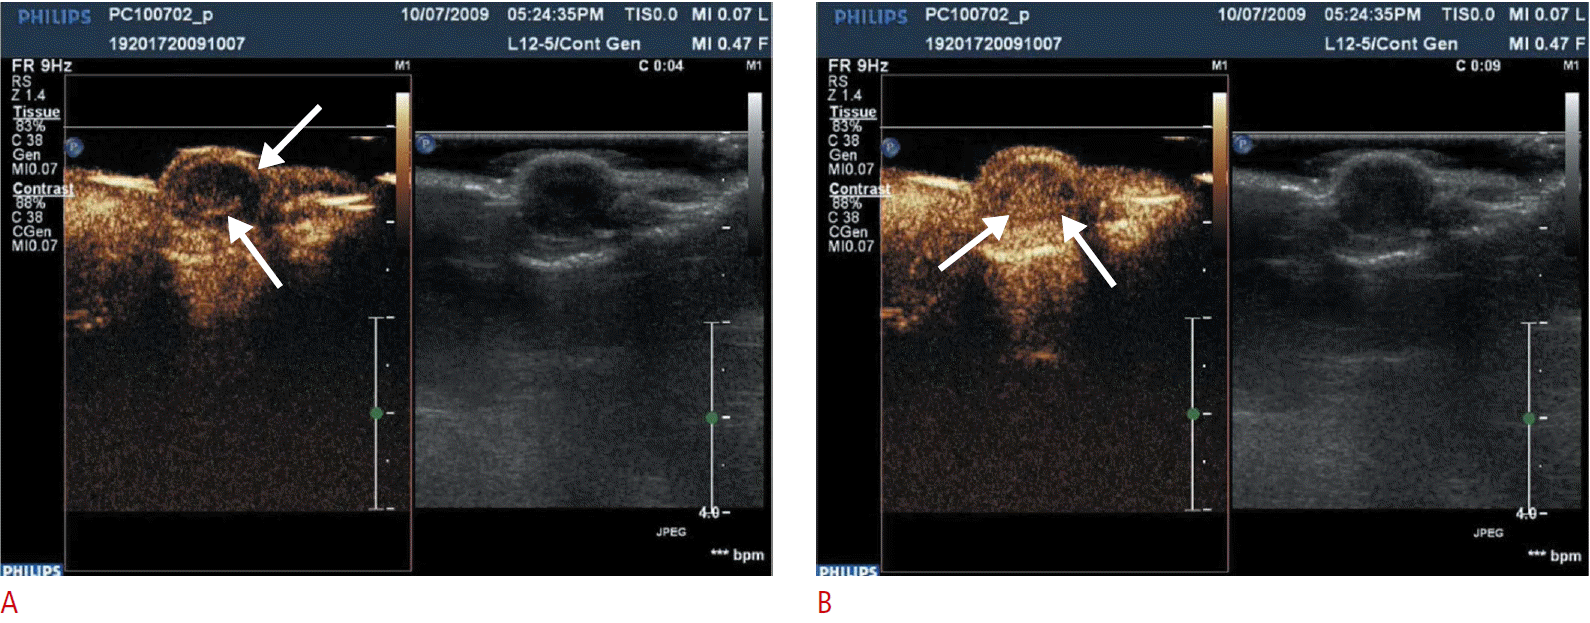 Fig.┬Ā3.Time-intensity curve from contrast-enhanced ultrasonography (CEUS).The time-intensity curve can be obtained by drawing the region of interest in the CEUS image data (arrows).
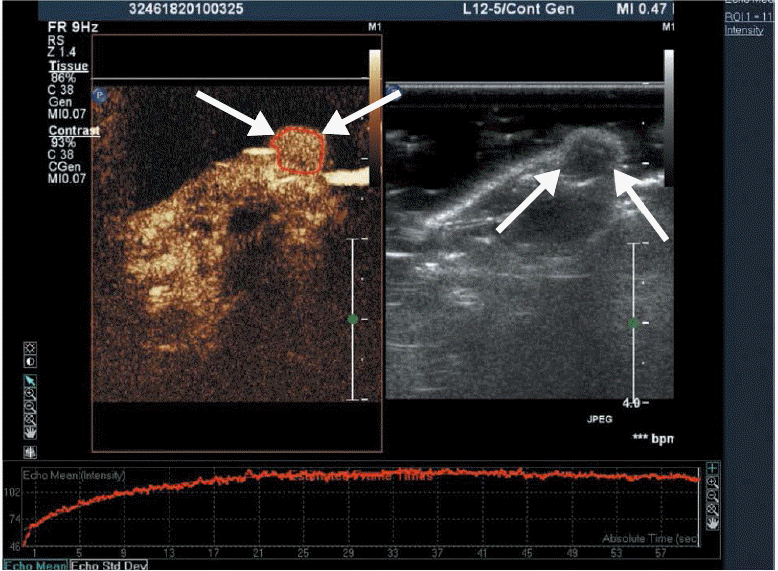 Fig.┬Ā4.Graphs showing the changes in volume (A) and area under curve (AUC) (B) during paclitaxel treatment.A. Graph of tumor volume shows no statistically significant changes of tumor volume (P=0.116). B. Graph of AUC from contrast-enhanced ultrasonography shows that the AUC was significantly decreased during the week after paclitaxel treatment (P=0.030).
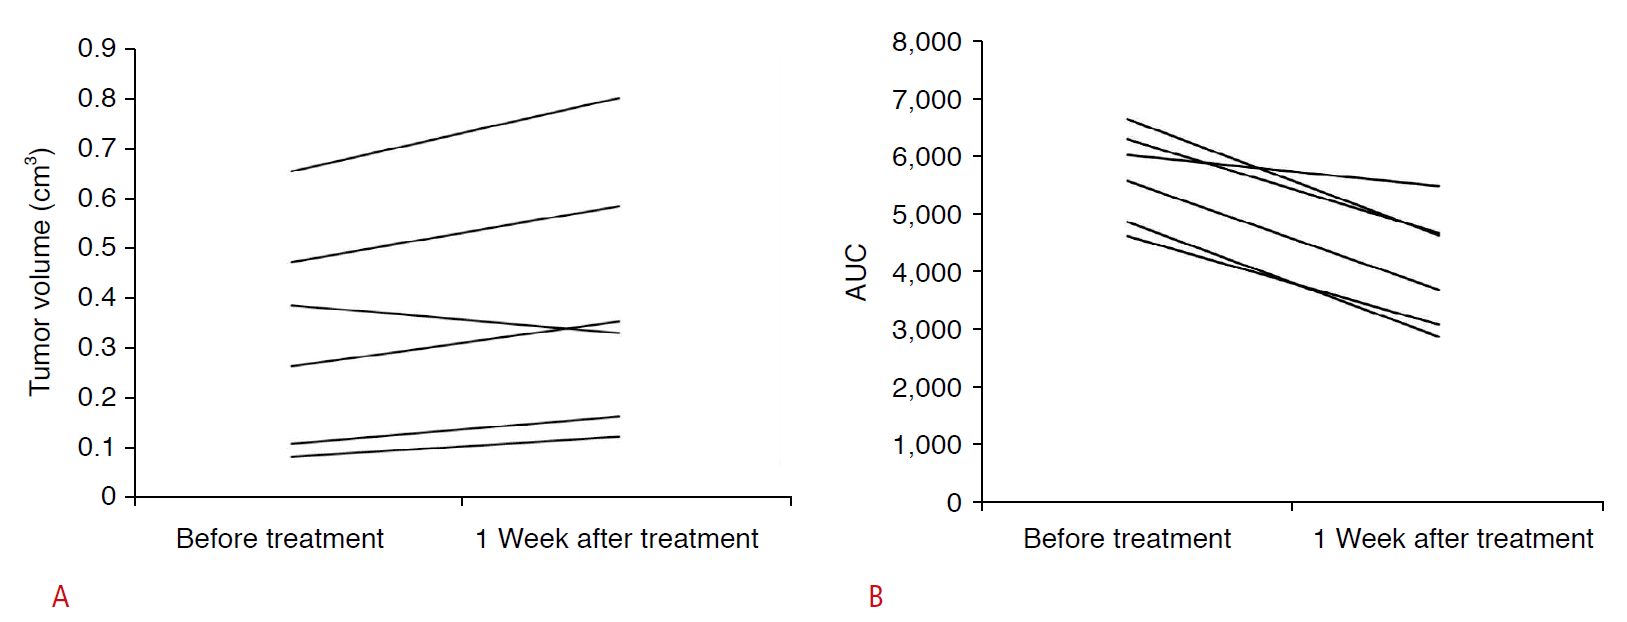 Fig.┬Ā5.Graphs showing the changes in volume (A) and area under curve (AUC) (B) of the control group.A. Graph of tumor volume shows the increase of tumor volume. B. Graph of AUC from contrast-enhanced ultrasonography shows that there was no statistically significant change of AUC values (P=0.173).
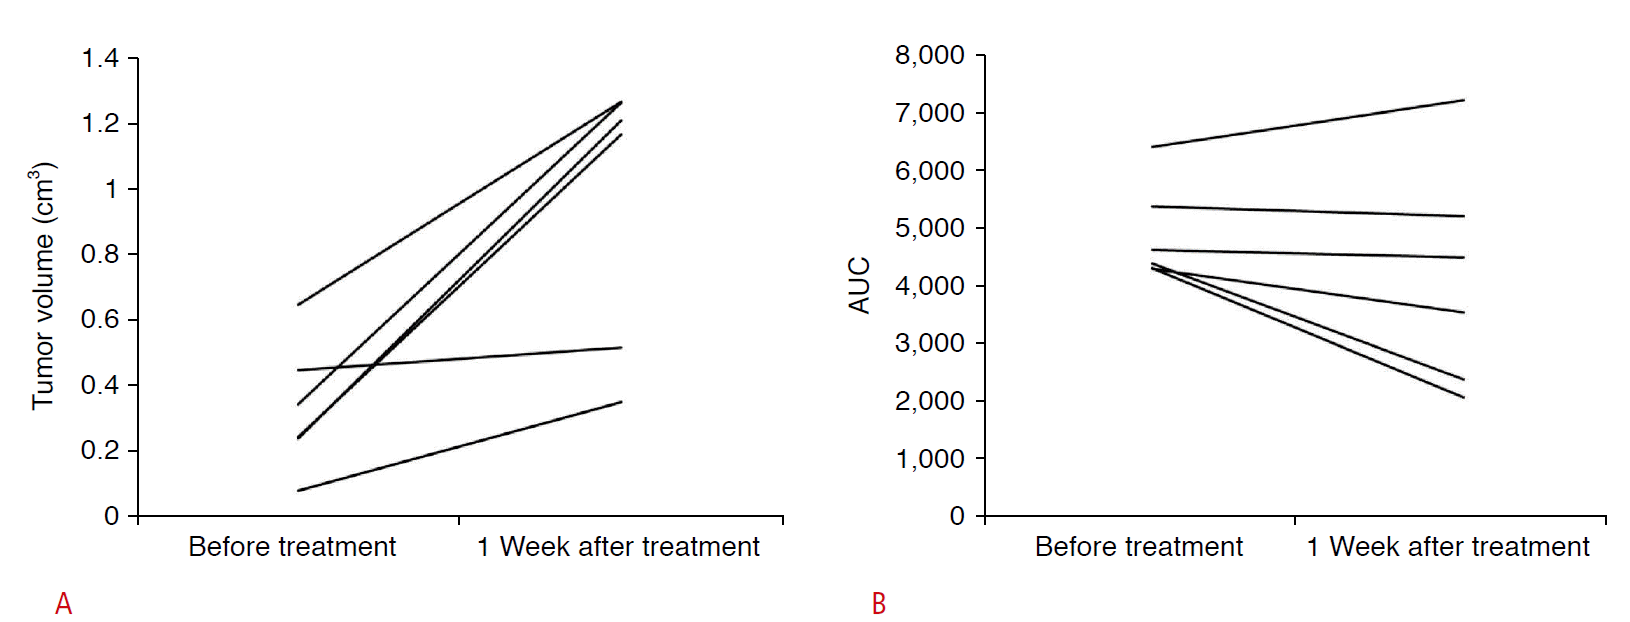 Fig.┬Ā6.CD31 immunohistochemical staining for evaluation of microvessel density (MVD) in the paclitaxel treatment group (A) and control group (B).A. Microphotograph of MVD (├Ś200) shows the brown staining of endothelial cells in the paclitaxel-treated group (arrows). B. The MVD in the paclitaxel-treated group is lower than that of the control group (├Ś200).
 Fig.┬Ā7.Table┬Ā1.Volume and AUC of each case |


 Print
Print facebook
 twitter
 Linkedin
 google+
 Download Citation
 PDF Links
 PubReader
 ePub Link
 Full text via DOI
 Full text via PMC


