Introduction
Tumor angiogenesis is the non-physiologic proliferation of blood vessels penetrating into cancerous tumors [1]. Tumor angiogenesis is fundamental for tumor growth, progression to invasive cancer, and metastasis [1,2]. Numerous anti-angiogenic agents are currently in use or under development based on our understanding of the angiogenic mechanism of breast cancer [1,3]. Therefore, the clinical assessment of tumor vascularity can help diagnose breast cancer, choose a management plan, and predict the prognosis. The gold standard for assessing tumor angiogenesis is immunohistochemical evaluation of microvessel density (MVD). MVD is highest in histopathologically aggressive ductal carcinoma in situ and is correlated with a greater likelihood of metastasis [4].
Color Doppler imaging (CDI) and power Doppler imaging (PDI) are widely available techniques used as adjuncts to gray-scale ultrasonography (US). Doppler signs suggestive of malignancy such as hypervascularity, central vascularity, and penetrating or branching vessels can help differentiate breast cancer from benign tumors [5-7]. However, there is a significant overlap of Doppler features between benign and malignant tumors because conventional Doppler imaging has limitations in detecting low-quantity and slow flow [8].
Recently, more advanced Doppler techniques and US contrast agents have been introduced to assess tumor vascularity more effectively. Superb microvascular imaging (SMI; Aplio 500 and later models from Toshiba Medical Systems Corporation, Tokyo, Japan) is a novel Doppler technique that improves sensitivity for microvessels, with high resolution and fewer motion artifacts. Contrast-enhanced ultrasound (CEUS) with second-generation contrast agents is another sensitive Doppler technique enabling the evaluation of tumor microcirculation and perfusion. In this review, we explain the imaging principles and earlier research underlying these two vascular techniques and describe our clinical experiences.
Superb Microvascular Imaging
Imaging Principles of SMI
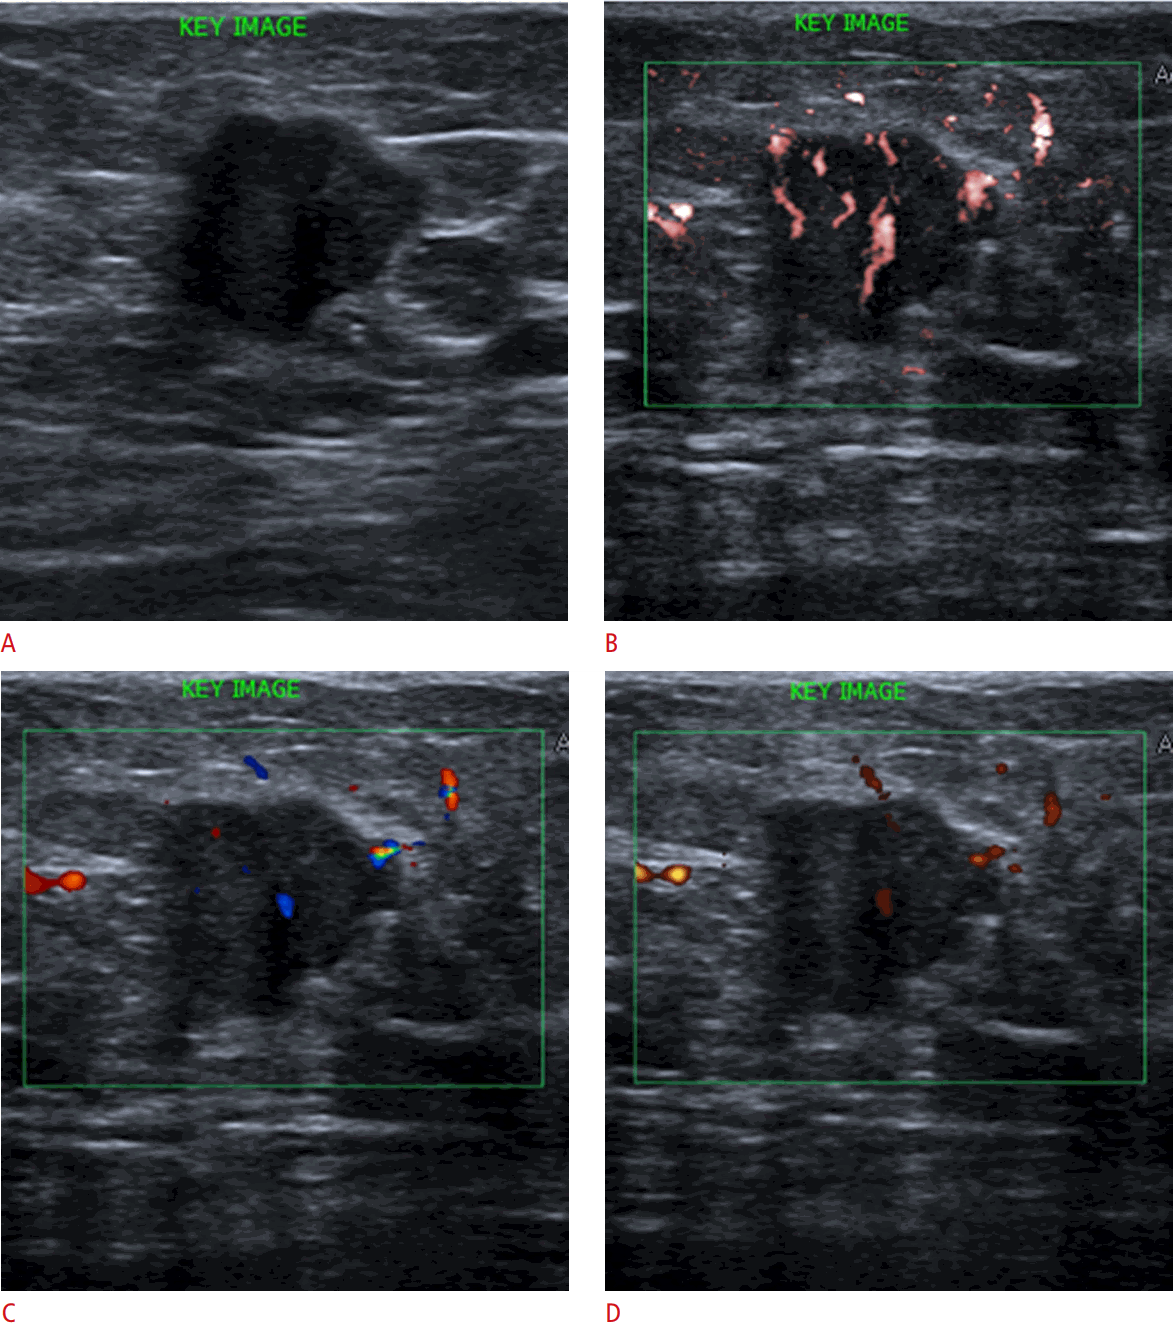
Ultrasonic Doppler signals derive not only from blood flow, but also from tissue motion (clutter). The clutter signals overlap the low-speed flow components. Conventional Doppler techniques apply a single-dimensional wall filter to remove clutter, resulting in loss of the slow component. In contrast, SMI uses a multidimensional filter to separate flow signals from clutter, thus removing only the clutter and preserving the slow flow signals (Fig. 1) [9] [11]. Fig. 2 shows a comparison of vascular findings among CDI, PDI, and SMI.
Imaging Acquisition of SMI
SMI provides two modes of vascular imaging: color and monochrome. The color mode demonstrates gray-scale and color information simultaneously. When using the color mode, it is possible to control the time smoothing function-also known as frame averaging-from grade 1 to 7. Increasing the time smooth improves temporal resolution by accumulating the flow signals acquired frame-by-frame, allowing vessel continuity to be evaluated more accurately. The monochrome mode focuses only on the vasculature, with its sensitivity improved by subtracting the background information. It is displayed side-by-side with the grayscale image.
To optimize the image quality, it is important to understand the Doppler imaging parameters and to become familiar with practical tips for SMI examinations. In Doppler imaging, various parameters can influence the imaging quality, and these parameters interact in complex manners. To increase sensitivity to flow signals, color gain should be increased to make the intensity of flow more apparent on the monitor [10]. In addition, the region of interest (ROI) width should be reduced to improve sensitivity. Increasing the ROI width reduces the frame rate because multiple pulses are needed for each line of sight [10]. In examinations using an early version of SMI (ver. 5.0, Aplio 500) that did not possess a direct scale control function, the scale could be controlled by changing the ROI width. In our experience, decreasing the ROI width to a scale less than 2.5 cm/ sec is recommended for improving the visualization of microvessels. Subsequent versions of SMI equipment provide a direct-control scale function. However, increasing color gain and decreasing the ROI width also lead to an increase in flash artifacts. Therefore, it is important to achieve maximal sensitivity without developing flash artifacts by upregulating color gain or downregulating ROI width in order to initially develop a flash artifact, and then to adjust these settings gradually until the flash artifact disappears. ROI depth is also associated with the frame rate, because increasing the ROI depth results in a longer wait time for returning echoes [10]. Therefore, the ROI setting should be as small and superficial as possible to improve sensitivity for microvessels and image resolution. Making patients hold their breath can be helpful to reduce motion artifacts. Finally, pressing the target lesion gently with the probe prevents the collapse of microvessels.
Utility of SMI in Breast Tumor Evaluation
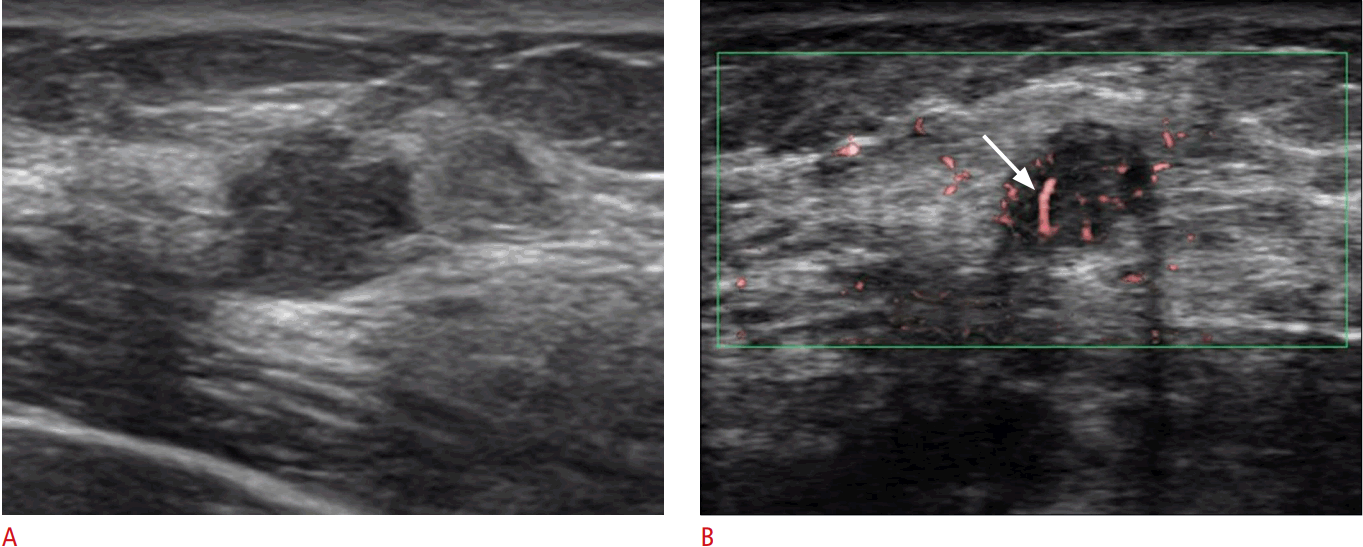
Recently, several studies have reported SMI to be superior to CDI or PDI in evaluating breast tumor vascularity and improving the diagnostic performance of US [9,11-14]. Ma et al. [11] reported that the degree of blood flow assessed with a grading system from 0 to 3 was significantly higher on SMI than on CDI, and that the difference in the value of vessel numbers between SMI and CDI (“SMI-CDI”) showed the best diagnostic performance in discriminating malignant from benign tumors (area under the curve [AUC] of “SMI-CDI” vs. AUC of SMI and CDI: 0.89 vs. 0.81 and 0.73, respectively) [15]. Park et al. [9] reported that SMI was the best technique for detecting a larger number of cancer vessels (mean numbers of vessels, 7.2±3.0 on SMI, 2.5±2.4 on CDI, and 2.8±3.0 on PDI) and evaluating penetrating or branching vessel morphology and both peripheral and central vascular distribution. Yongfeng et al. [12] reported that SMI detected a larger number of flow signals than PDI and showed improved sensitivity (86% vs. 71%) when a centrally distributed branching or diffusing morphology was used as a criterion for malignancy. Zhan et al. [13] reported that SMI showed significantly higher median numbers of penetrating vessels in avascular masses assessed as Breast Imaging Reporting and Data System category 3 or 4, and that the diagnostic performance was improved by detecting penetrating vessels (AUC increased from 0.914 to 0.947). Common features suggestive of malignancy in these investigations include hypervascularity, branching or penetrating vessel morphology, and the presence of central vascularity and peripheral vascularity. These vascular signs reflect the microscopic features of angiogenesis in breast cancer, including immature capillary overgrowth from the surrounding vessel toward the inside of the lesion [2]. SMI also showed a higher correlation with MVD than CDI (r=0.82 vs. r=0.68) in recent research by Ma et al. [14]. Fig. 3 demonstrates the findings of SMI for a malignant tumor that was assessed as category 4A on gray-scale US.
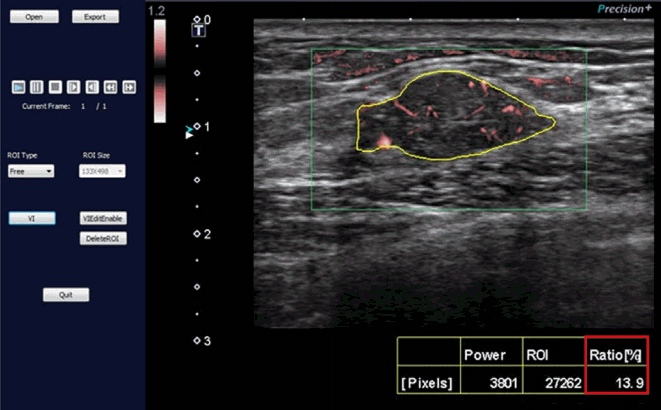
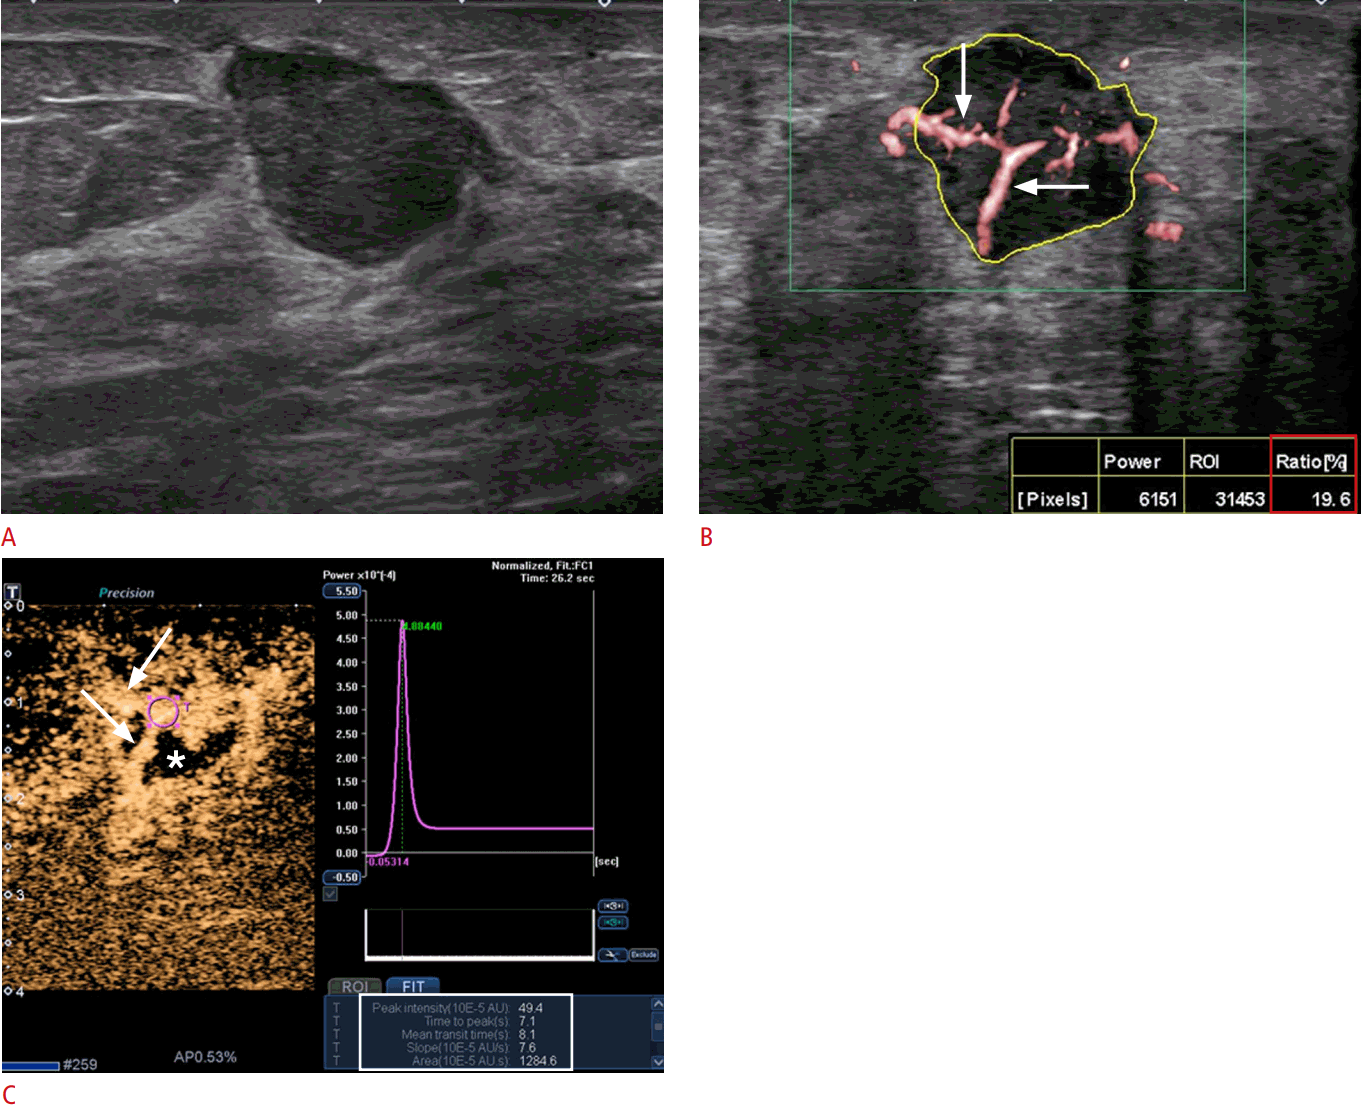
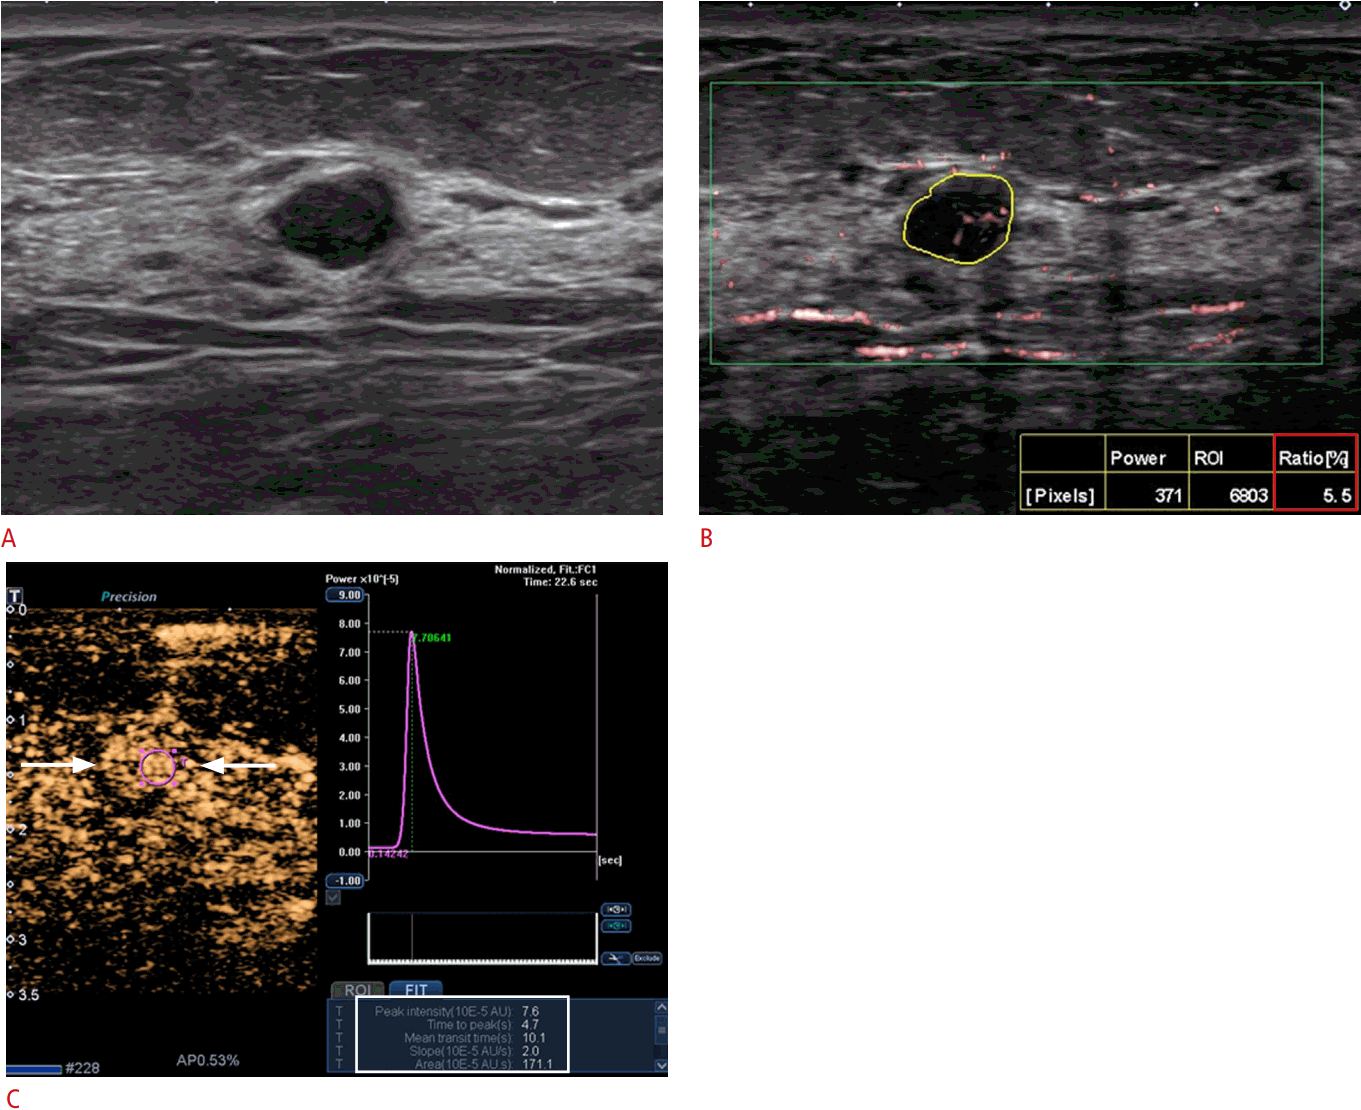
Furthermore, the quantitative analysis of tumor vascularity recently became possible by calculating the vascular index using dedicated software (the VI Test App from Toshiba Medical Systems Corporation) (Fig. 4). The vascular index (%) is the ratio between the pixels for the Doppler signal and those for the total lesion. We expect that this parameter will provide valuable information about the degree of vascularity, together with the previously discussed qualitative assessment.
Potential and Limits of SMI
SMI shows superior sensitivity for microvessels, and thus allows us to evaluate vessel complexity and distribution in more detail, which can improve the diagnostic performance for diagnosing breast malignancy. Furthermore, a quantitative analysis of the vascular index is expected to provide more objective information about the degree of vascularity. However, a measure of the learning curve is needed for SMI to be used more efficiently. Knowledge of practical tips about SMI and repeated clinical application are important for obtaining optimal-quality images.
Finally, further investigation is needed to identify the optimal cut-off value of the vascular index and qualitative criteria useful for discriminating breast cancer from benign tumors. By extension, the correlations between SMI features and various histopathologic factors, such as MVD, histologic grade, lymph node status, tumor diameter, hormone receptor status, and tumor gene expression might be one of the next areas of research to determine whether preoperative SMI examinations can be helpful in predicting the prognosis and/or choosing a treatment plan for patients with breast cancer.
Contrast-Enhanced Ultrasound
Imaging Principles of CEUS
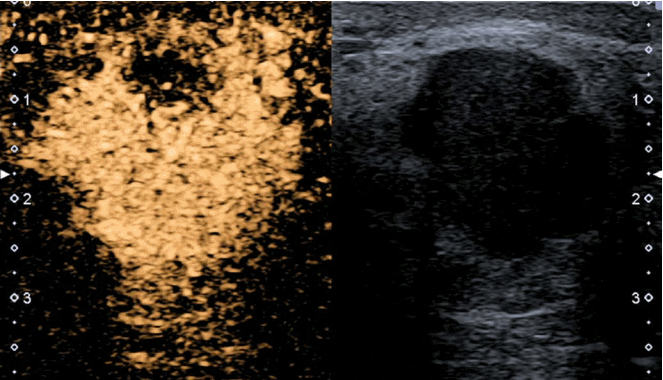
CEUS is the application of ultrasound contrast agents to medical US. A microbubble US contrast agent in the vasculature enhances the backscatter of US waves. This results in a marked amplification of the flow signals, providing information about the microvasculature (Fig. 5) [16].
With the introduction of second-generation US contrast agents and the development of a contrast-specific mode with a low mechanical index (MI; <0.3), continuous and real-time scanning has become possible [17,18].
The second-generation contrast agents consist of a shell containing a polymer-based material and internal slowly diffusing gas such as hexafluoride or perfluorobutane [17]. These low-solubility gases circulate in the blood pool with a stronger and longer-lasting signal enhancement, allowing hemodynamic evaluation. Commercially available agents include SonoVue (Bracco SpA, Milan, Italy), Definity (Lantheus Medical Imaging, North Billerica, MA, USA), and Sonazoid (Daiichi-Sankyo, Tokyo, Japan) [18]. Most investigations of breast tissue to date have used SonoVue or Sonazoid [19-27].
The MI is an estimate of the maximum amplitude of the pressure pulse in tissue, reflecting the power of the system [18]. A higher MI corresponds to higher acoustic power, resulting in a more rapid disruption of the microbubbles [18]. Therefore, a low-MI technique enables microbubble agents to remain static.
The contrast-specific mode refers to US technology that can discriminate the non-linear signals generated by the US contrast agents from the linear signals generated by the tissue [17]. Because the non-linear signals from the tissue and the US contrast agents are proportional to the MI, a low-MI technique offers a more discriminative reception of non-linear signals from the US contrast agents by decreasing the non-US contrast agent signals [17].
Imaging Acquisition of CEUS
In CEUS examinations, the contrast-specific mode should be activated first. Immediately after the contrast agent is injected via a peripheral vein in a bolus fashion, continuous scanning for the target lesion is performed. The CEUS images can be stored as a video for repeated subsequent analyses.
With CEUS and second-generation contrast agents, both qualitative and quantitative approaches are available for image interpretation [19]. Qualitative analysis includes the evaluation of the enhancement patterns of the lesion, including the enhancement degree, order, margin, internal homogeneity, penetrating vessel, and perfusion defect. Quantitative analysis includes time-intensity curve analysis, such as the kinetic curve analysis of contrast-enhanced dynamic magnetic resonance imaging (MRI). All US systems are supplied with built-in analysis packages, and off-line software packages such as Qontrast (Bracco) are also available [18,20].
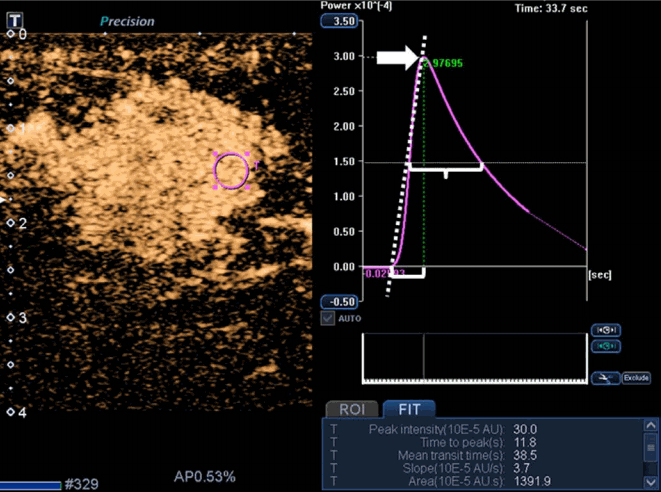
In our institution, CEUS examinations were performed in two steps: (1) injection of 3.6 mL of the contrast agent and continuous scanning for 2 minutes for subsequent time-intensity curve analysis, and (2) injection of another 1.2 mL of contrast agent after a waiting period of 16 minutes from the first injection for microflow imaging. The built-in software was used for time-intensity curve analysis [28]. An ROI was placed selectively in the area of the strongest enhancement, and the following quantitative parameters were automatically calculated: peak intensity, the maximum intensity of the time-intensity curve; time to peak (TTP), the time needed to reach peak intensity from the time the first microbubble reached the lesion; the mean transit time, the time for which intensity is higher than the mean value; slope, the maximum wash-in velocity; and area under the time-intensity curve, proportional to the total volume of blood in the ROI and the sum of area wash-in and area wash-out. Fig. 6 demonstrates the time-intensity curve of CEUS and its parameters.
Utility of CEUS in Breast Tumor Evaluation
Many studies have investigated the CEUS features associated with malignant breast tumors and the contribution of CEUS to diagnostic performance, although variation was present in the US equipment, the contrast agent used and its dose, the quantitative analysis software, and the classifications used for image interpretation [8,20]. Common signs suggestive of malignancy included heterogeneous or peripheral enhancement, centripetal enhancement order, penetrating vessel and perfusion defect, early intense wash-in, and fast wash-out [19,20,22-24]. Several studies have explained these enhancement characteristics in relation to the histopathologic features of breast cancer. Liu et al. [29] reported that peripheral enhancement was associated with hypercellularity or adenosis at the periphery and hypocellularity, fibrosis, or necrosis in the center, whereas heterogeneous enhancement was associated with tumor cell cords or clusters in a variable amount of desmoplastic stroma. Wan et al. suggested that early intense wash-in (shorter TTP or higher ascending slope) and fast wash-out were related to high-velocity flow through arteriovenous shunts inside malignant lesions [19,30].
Most studies reported that the addition of CEUS to gray-scale US improved diagnostic performance compared with gray-scale US alone, with sensitivity ranging from 64% to 100% and specificity ranging from 38% to 97% [19-21,23,25-27,31,32].
In addition, Du et al. [22] reported that the diagnostic performance of a combination of gray-scale US and CEUS was equivalent to that of MRI (AUC, 0.94 vs. 0.91; accuracy, 90.2% vs. 91.8%). Ricci et al. [25] also reported equivalent diagnostic performance between CEUS and MRI (sensitivity, 100% vs. 100%; specificity, 87.5% vs. 87.5%; accuracy, 94% vs. 94%).
Recently, a clinical study comparing the diagnostic performance of SMI and CEUS in discriminating between malignant and benign breast tumors was published. Xiao et al. [33] evaluated 132 breast tumors with SMI and CEUS and classified the microvascular architecture of breast lesions into five patterns. They concluded that the root hair-like and crab claw-like patterns were associated with breast cancer, and the diagnostic performance of SMI was not different from that of CEUS when using these patterns as diagnostic criteria (sensitivity, 77.6% vs. 89.6%; specificity, 90.5% vs. 87.8%; accuracy, 84.8% vs. 88.6%; AUC, 0.865 vs. 0.791) [33].
Potential and Limits of CEUS
The diagnostic performance of CEUS in discriminating breast cancer from benign tumors has greatly improved due to the development of high-end US systems and the introduction of second-generation US contrast agents. The development of dedicated software also allows the more objective quantitative analysis of lesion vascularity. However, there are no standardized criteria for differentiating between malignant and benign tumors because different US equipment, contrast agents, and quantitative analysis software are currently used, and there is no general consensus about the methods of imaging acquisition and interpretation, such as the dose of contrast agent, the ROI setting for time-intensity curve analysis, and imaging parameters. In addition, the need for intravenous contrast injection and time-consuming post-imaging analysis might explain why CEUS is not routinely used in clinical practice [20].
Summary
SMI and CEUS can be useful adjunctive US techniques for evaluating breast tumors by assessing the microvasculature. Both quantitative and qualitative analysis of microvessels within breast tumors can provide valuable information for discriminating breast malignancies from benign tumors. However, wider application and further large-scale investigations are needed to standardize the methods of image acquisition and interpretation of both US techniques and to achieve consensus about clinically practical diagnostic criteria for diagnosing breast cancer.
Although there have been only a few studies to date, the diagnostic performance of SMI seems to be equivalent to that of CEUS. In consideration of the advantages of SMI, such as not needing contrast agent injection or a time-consuming post-imaging analysis, SMI might be a useful alternative vascular imaging technique to CEUS.


 Print
Print facebook
 twitter
 Linkedin
 google+

 Download Citation
 PDF Links
 PubReader
 ePub Link
 Full text via DOI
 Full text via PMC


