

 Print
Print facebook
 twitter
 Linkedin
 google+

Introduction
The lymphatic system is known to be involved in cancer metastasis (the spread of cancer from the primary tumor to other organs), and our understanding of the mechanisms of metastasis continues to evolve. Lymphatic vessels, which reach regional lymph nodes (LNs), are a possible metastatic route for cancer cells [1]. LNs act as barriers that temporarily block the further spread of cancer cells. Once malignant metastatic cells spread and are observed in the LNs, current medical treatment options may be insufficient to provide a complete cure, resulting in an increased risk of mortality [2]. Therefore, the diagnosis of metastatic LNs is crucial for treatment planning, which can include surgery, radiation therapy, or adjuvant chemotherapy. Numerous methods have been used clinically to diagnose LN metastasis, including lymphoscintigraphy, computed tomography (CT), single-photon emission CT, near-infrared fluorescence imaging, photoacoustic imaging, magnetic resonance imaging, and ultrasonography (US) [3]. These modalities provide sufficient information for clinicians and surgeons to decide on a treatment method, but some have limitations for intraoperative use, such as a requirement to transfer the patient to an imaging facility and a relatively long preparation time. US has several advantages over alternative techniques such as positron emission tomography/CT and lymphoscintigraphy, including the absence of radiation exposure or other harmful effects, easy accessibility, and lower costs [4,5].
Various modes of US exist, including as B-mode and color Doppler. Contrast-enhanced US (CEUS) combines traditional US with an ultrasound contrast agent [6]. CEUS images are generated from differences in acoustic impedance between soft tissues and gas in the ultrasound contrast agent, which contains commercial microbubbles (MBs). MBs are micron-sized bubbles (1-10 μm) filled with non-toxic and safe gas (sulfur hexafluoride, SF6) that have been developed in various formulations to enhance contrast, circulation time, and stability since Gramiak and Shah [7] first showed that they improved contrast in echocardiography in the 1960s. Because MBs are administered intravenously, the applicability of MBs depends on the vascularity of specific organs or tumors. Some attempts have been made to visualize sentinel LNs (SLNs) in animal models and breast cancer patients using CEUS imaging [8-12]. To enhance diagnostic accuracy and facilitate intraoperative imaging, it is necessary to compare CEUS images with pathologic images from the same region. However, to our knowledge, few reports have conducted a comparative analysis of 1-to-1-matched CEUS and pathologic images.
In this study, with the ultimate goal of leveraging our findings for application in clinical practice, we utilized a US imaging modality and commercial MBs (SonoVue) to identify micro-metastases in popliteal LNs metastasized from VX2 tumors on the thigh in a rabbit model.
Materials and Methods
Preparation of Animal Model
This study was approved by the institutional animal care and use committee of our hospital. Twelve adult New Zealand white rabbits, weighing 2.0 to 2.5 kg, were maintained in rooms with a constant temperature (23°C±2°C) and a 12-hour light/dark cycle. Throughout the study period (December 2015 to February 2017), the VX2 tumor strain was maintained in the hind limb of a carrier rabbit through deep intramuscular injection [13-15]. To establish a model of the VX2 tumor and metastatic LNs, fresh tumor tissues without signs of necrosis were harvested and collected. Then, the collected tumor tissues were finely ground and subcutaneously injected into the other rabbits, just below the right hind limb, to induce VX2 tumor establishment and popliteal LN metastasis. After inoculation, the tumor and popliteal LNs were monitored. In our study, the early stage of LN metastasis (group C) was normally examined on the 10th day, the growth stage (group B) on the 14th day, and the advanced stage (group A) on the 21st day after inoculation.
US Contrast Agent and Instrument
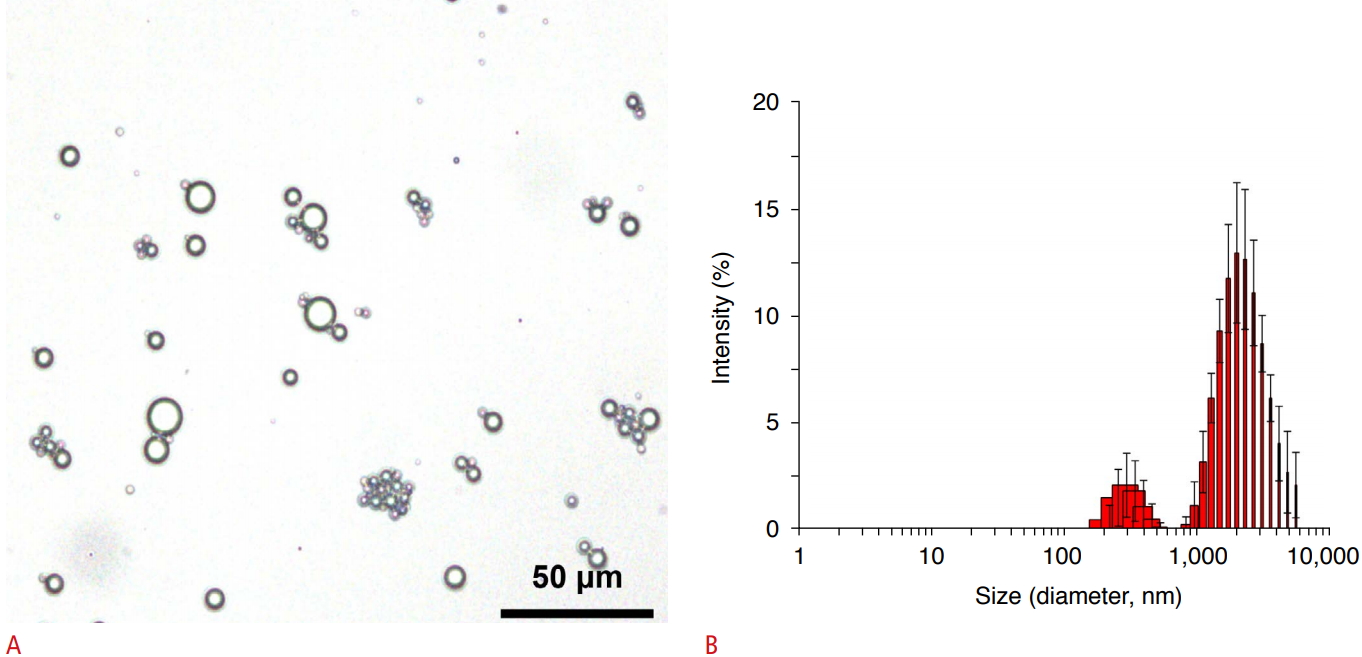
The US contrast agent, SonoVue (Bracco, Milan, Italy), was reconstituted according to the manufacturer’s instructions. Its size and morphology were characterized by Zetasizer (Nano ZS, Malvern Instruments, Malvern, UK) and an upright optical microscope (BX63, Olympus, Tokyo, Japan). Fig. 1 shows the shape and size of the MBs. Their average size was 2.2±0.6 μm by the dynamic light scattering technique, with a broad size distribution, ranging from a few hundred nanometers to 10 μm.
Gray-mode US imaging and CEUS were performed using a clinical US system (iU22, Philips Healthcare, Best, The Netherlands) with a L12-5 broadband linear transducer. To reduce MB destruction, low mechanical index values were applied for imaging (0.2-0.4).
Before the US examinations, animals were anesthetized with respiratory anesthetic (isoflurane, Hana Pharm, Seoul, Korea). Rabbits were placed in the supine position, and the hair around the tumor and popliteal area was shaved to minimize differences in acoustic impedance between the US probe and the skin.
Before injection of the contrast agent, conventional US was performed in an attempt to identify the VX2 tumor and adjacent LNs. Then, 2.5 mL of SonoVue solution was administered subcutaneously in the right foot. The injection was performed slowly in an attempt to avoid the rupture of MBs via high pressure during the injection. The injection site was massaged for approximately 1 minute to accelerate the movement of MBs into the lymphatic channels and LNs. Then, CEUS was performed in the popliteal area in an attempt to identify the metastatic LNs in the right leg and the normal LNs in the contralateral leg. The patterns of enhancement of the LNs were observed and recorded. After the CEUS study, the metastatic LNs on the right leg and the control LNs on the contralateral leg were harvested and prepared using standard hematoxylin and eosin (H&E) staining for histopathologic examinations.
Quantitative Image Analysis
Two radiologists with over 15 years of experience in US reviewed the video clips showing the CEUS examination of the LNs without knowledge of group allocation. They were asked to reach a consensus on the status of LNs as either positive or negative according to the presence or absence of perfusion defects in them.
For a quantitative analysis of LN metastasis, the tissue slides after H&E staining were scanned using a slide scanner (Super Cool Scan, Nikon, Tokyo, Japan) in the TIFF format. The scanned images were uploaded into the Image J program version 1.4.3.67, which is freely available for download from the website of the National Institutes of Health. Under the supervision of a pathologist, the outlines of the LNs and metastatic lesions were drawn manually. The size and area of the LNs and metastatic lesions were measured. The percentage of metastatic areas in the LN was calculated as (metastatic area [cm2]/LN area [cm2]×100). The percentage of areas with perfusion defects was also measured and calculated using the formula [(area of gray image-area of CEUS image)/area of gray image]×100. To indicate the results of the 1-to-1 matching of the images, positive (+) and negative (-) signs are presented in Table 1, representing identical or different diagnoses between the histologic and ultrasonic analyses, respectively.
Statistical Analysis
The animals were divided into three groups by the metastatic LN area on the right leg based on the pathologic specimens: group A (n=4), over 1.9 cm2; group B (n=4), between 1 and 1.9 cm2; and group C (n=4), less than 1 cm2. In each group, the length, width, and area of LNs; the metastatic area in the LNs; the percent area of metastasis; and the perfusion defects in the LNs were analyzed and compared using the Kruskal-Wallis and Mann-Whitney U tests. Moreover, the length of the normal LNs on the contralateral leg was measured and compared using the same statistical tests. In all statistical analyses, a two-tailed P-value of less than 0.05 was considered to indicate a statistically significant difference. Statistical analyses were performed using SPSS version 19.0 for Windows (IBM Corp., Armonk, NY, USA).
Results
Categorization of LNs
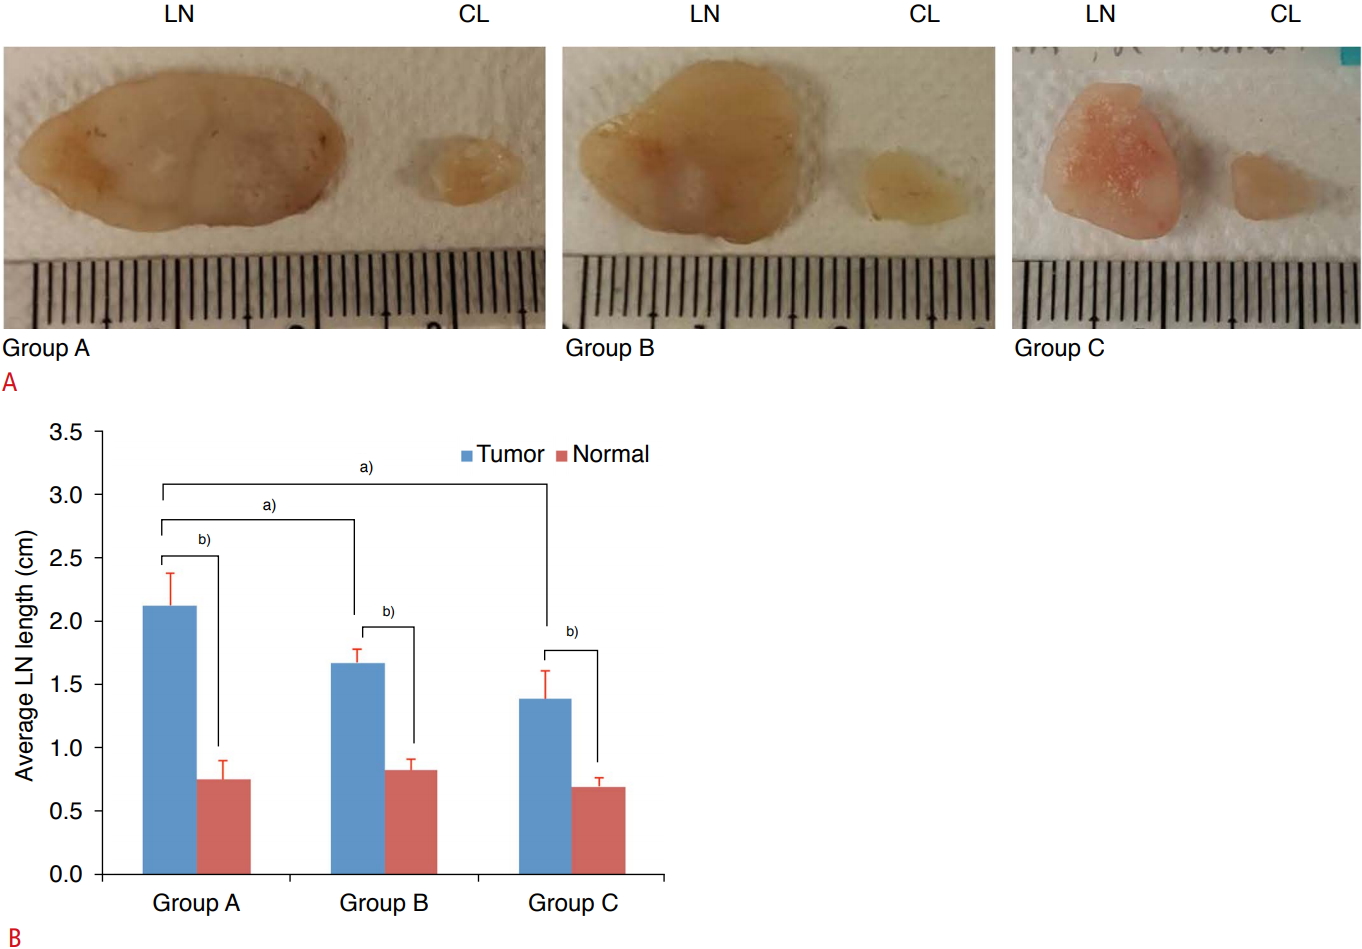
We investigated whether a higher metastatic stage was correlated to LN size. LNs were classified by the size of the metastatic LN. Fig. 2A shows representative pictures of both metastatic (left) and normal (right) LNs in each group. Fig. 2B is a bar graph of the average LN size, and Table 1 shows the sizes of all LNs and tumors.
The mean length of the metastatic LNs in each group was 1.99±0.51 cm (range, 1.85 to 2.20 cm) in group A, 1.32±0.33 cm (range, 1.50 to 1.13 cm) in group B, and 1.15±0.12 cm (range, 0.90 to 1.50 cm) in group C. The mean width of the metastatic LNs in each group was 1.42±0.32 cm (range, 1.02 to 1.70 cm) in group A, 0.92±0.17 cm (range, 0.75 to 1.14 cm) in group B, and 1.04±0.04 cm (range, 0.90 to 1.50 cm) in group C. The length of the metastatic LNs in each group was significantly different (P=0.019, Kruskal-Wallis test). A paired group analysis revealed that there was a statistically significant difference between groups A and B (P=0.021, Mann-Whitney test), as well as between groups A and C (P=0.021, Mann-Whitney U test). The width of the metastatic LNs did not show any statistically significant differences (P=0.073, Kruskal-Wallis test). The mean width of the normal LNs on the contralateral leg was 0.75±0.19 cm (range, 0.63 to 0.90 cm) in group A, 0.80±0.08 cm (range, 0.69 to 0.90 cm) in group B, and 0.58±0.10 cm (range, 0.50 to 0.71 cm) in group C. The size of the normal LNs showed no statistically significant difference among the three groups (P=0.078, Kruskal-Wallis test).
CEUS Findings of the Metastatic LNs
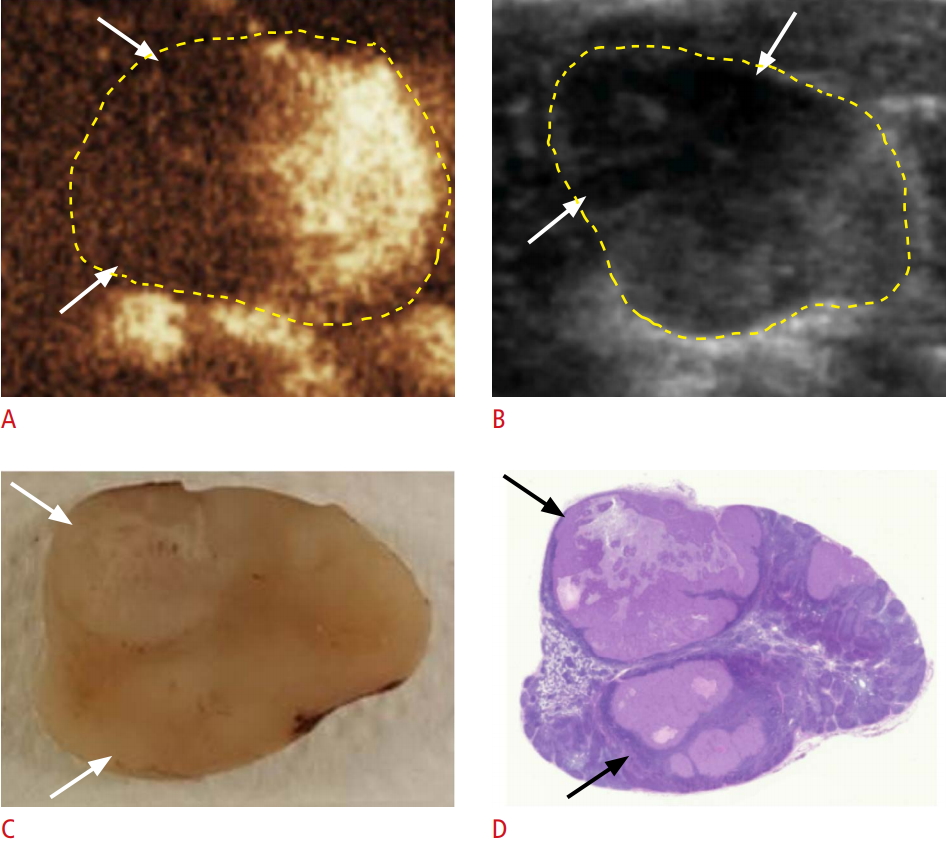
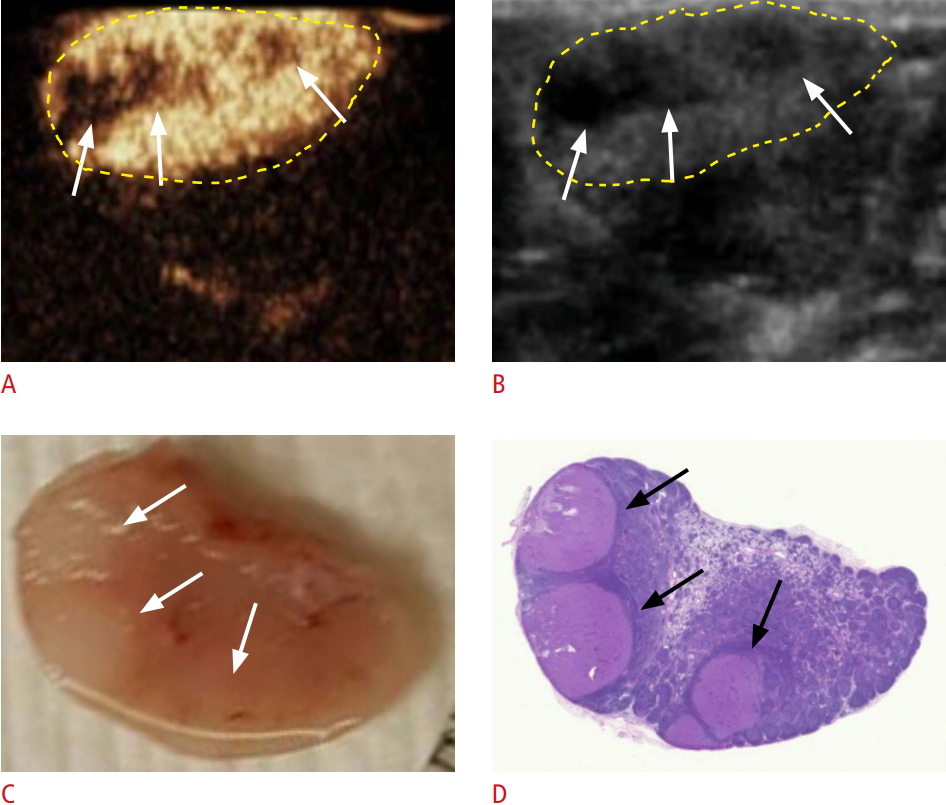
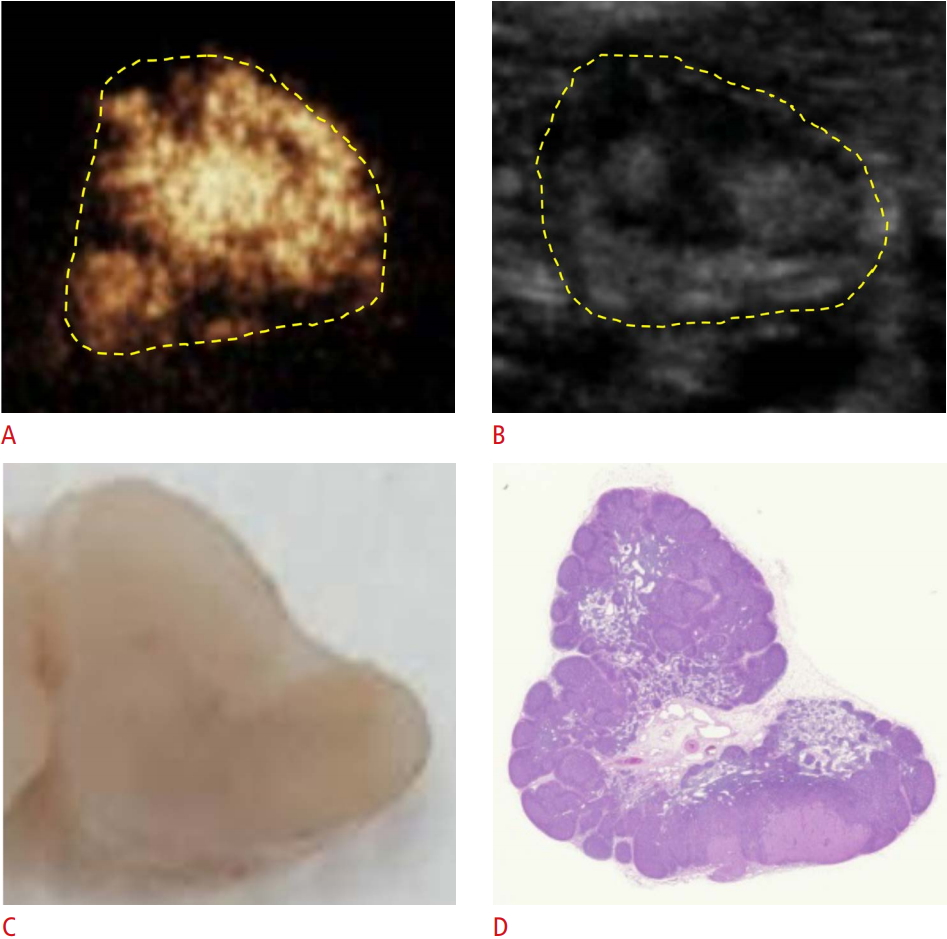
The metastatic LNs were observed by a clinical US system using CEUS, and visualized as perfusion defects within normally-enhancing tissues. Figs. 3-5 show representative findings of metastatic LNs seen on CEUS in each group.
Table 1 also shows the percent area of metastasis and perfusion defects in the LNs. All cases in group A were over 1.9 cm2 in area, and the mean area percentage of metastasis was 40.7%±19.4%. The percent area of perfusion defects was 74.5%±9.8%. All cases of metastasis were clearly visualized as round perfusion defects on CEUS (Figs. 3, 6). Group B was categorized as having an LN area between 1.0 cm2 and 1.9 cm2, and the mean percent area of metastasis was 21.5%±14.4%. The percent area of perfusion defects was 42.3%±9.7%. The CEUS findings showed multiple round, filled defects revealing metastatic areas (Figs. 4, 6). Even though a perfusion defect was detected in all cases, 1 case (B-4 in Table 1) showed a discordant finding in comparison to the pathologic analysis. Group C was categorized as having a mean metastatic area of less than 1.0 cm2, and the mean percent area of metastasis was 9.1%±6.4%. The percent area of perfusion defects was 30.0%±9.5%. Only one case (C-1 in Table 1) showed a small perfusion defect on CEUS. Fig. 5 shows LNs with a minimal metastatic area. In all the groups, metastatic LNs with a perfusion defect area over 40% were positively matched with the pathologic results.
The dimensions of the metastatic LNs, the metastatic area of LNs, and the percent area of metastatic LNs among the three groups all showed statistically significant differences (P=0.007, P=0.010, and P=0.049, respectively; Kruskal-Wallis test). The area of metastatic LNs was significantly different in all three groups (P=0.021, Mann-Whitney U test), between groups A and B (P=0.021, Mann-Whitney U test), and between groups A and C (P=0.020, Mann-Whitney U test). The percent area of metastatic LNs was significantly different between groups A and C (P=0.021, Mann-Whitney U test).
Proposed Mechanism
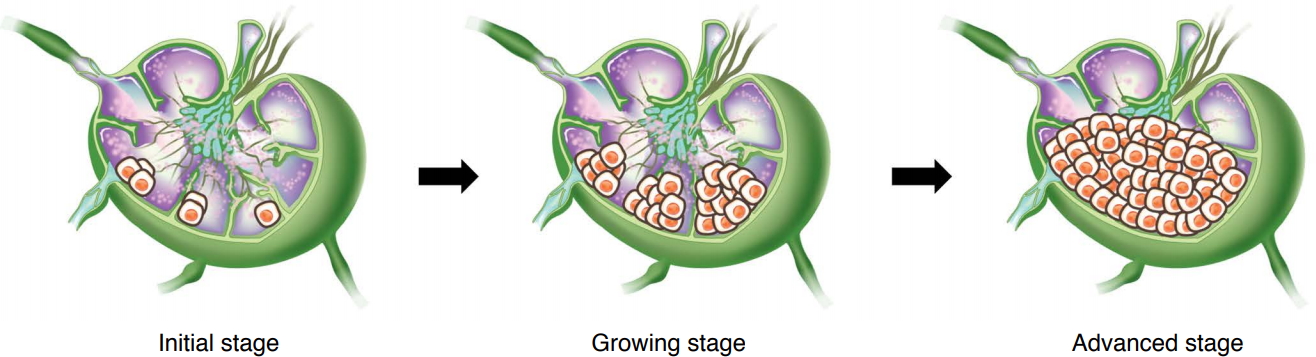
We visualized metastatic LNs on CEUS imaging and categorized them into three stages: the initial stage, the growth stage, and the advanced stage. Fig. 6 illustrates the gradual progression of LN metastasis that we propose. As illustrated by the LNs in group C, which had metastatic areas ranging from 9% to 20%, in the initial stage in Fig. 6, tiny and suspicious lesions are found in the peripheral portions of LNs. In group B, with a metastatic area ranging from 20% to 40%, multiple nodular perfusion defects were noted, corresponding to the growth stage. In group A, with a metastatic area of over 40% (the most advanced cases in our study), multiple nodular lesions were conglomerated, corresponding to the advanced stage.
Discussion
SLNs, which are the first to receive lymphatic drainage from a cancer, are at the highest risk for regional metastasis [3,9]. The accurate detection and evaluation of SLNs are critical for diagnosing and staging cancer, estimating the prognosis, and deciding on a treatment plan [16-19].
Some methods exist for detecting SLNs intraoperatively. First, radio-colloid scintigraphy with intraoperative gamma probe counting or injection of blue dye is clinically useful in patients with melanoma and breast cancer; it is associated with a success rate of more than 95% and a failure rate of less than 3.4% in SLN identification [19-26]. However, the conventional methods of SLN detection have some limitations. First, the limited spatial resolution of lymphoscintigraphy may pose difficulties in providing accurate anatomic information during a preoperative evaluation. Second, the intraoperative gammaprobe counting technique has inherent subjectivity in the detection method itself, as it requires a certain degree of operator experience with LN detection. Moreover, the high level of radioactivity at the primary injection site can hinder the detection of radioactive hot nodes by a gamma probe [22-24,27-30].
In the last decade, researchers have focused on applying CEUS with MBs for this purpose [31-36]. Some reports have demonstrated consistent positive results regarding CEUS images of metastasis. Goldberg and colleagues described that uniformly increased echogenic SLNs did not contain metastases, whereas SLNs in areas that did not enhance had metastases [35]. Wang et al. [9] asserted that unenhanced areas of LNs may be related to abnormal lymphatic drainage, caused by factors such as tumor infiltration, proliferation, and chronic inflammation. Cox et al. [12] demonstrated the possibility of detecting SLNs in breast cancer patients using CEUS; only 2% of patients with an initial benign SLN core biopsy were found to have two or more LN metastases. Recognition of SLN metastases using conventional gray-scale US is difficult early in the process of diagnosis and treatment. Detection and recognition via CEUS may be helpful for deciding upon a therapeutic strategy, such as initiation of neoadjuvant chemotherapy [37]. However, those studies did not differentiate between partially-metastatic LNs and micro-metastatic LNs in CEUS findings.
There are two main limitations of our study. First, the number of animals was not enough to clearly detect and classify LNs by the combined technique of CEUS and MBs in the early stage and the growth stage with approximately 1-cm LNs. To improve the sensitivity and specificity, we plan to conduct a further animal study. Second, because US examinations are intrinsically subjective, our results may reflect the radiologist’s experience. A possible resolution may be for multiple radiologists to participate or to conduct a cross-confirmation using a secondary imaging modality or dye staining. However, SLN biopsy is the gold standard for patients with breast cancer and melanoma according to the National Comprehensive Cancer Network guideline.
In conclusion, we demonstrated that metastatic LNs could be successfully detected by CEUS imaging with a commercial contrast agent. Perfusion defects could be clearly detected in LNs with a metastatic area exceeding 40%, and the CEUS images were compared with pathologic images to evaluate their correspondence. The high level of correspondence between the CEUS and pathologic images enabled not only the evaluation of metastatic LNs, but the determination of the stage of metastasis using CEUS imaging with a contrast agent. LN metastasis initially occurs as multiple peripheral lesions located in the peripheral area, then grows as multiple nodular filling defects, and finally becomes a conglomeration of filling defects on CEUS. Due to the wide accessibility of US imaging modality and real-time monitoring during surgery, we expect that CEUS imaging will become a feasible alternative modality for evaluating LNs in the clinic.
 Download Citation
 PDF Links
 PubReader
 ePub Link
 Full text via DOI
 Full text via PMC


