

 Print
Print facebook
 twitter
 Linkedin
 google+

Introduction
Hepatocellular carcinoma (HCC) surveillance is implemented to improve the outcomes of high-risk individuals and to detect HCC in its early stages [1]. A primary imaging modality recommended for this surveillance is liver ultrasound (US) [2]. However, the sensitivity of liver US is widely known to be limited in the detection of early-stage HCC. A recent meta-analysis revealed that the sensitivity of early-stage HCC detection using US alone was 45%, which is quite low [3]. The low detection sensitivity of US is closely associated with inadequate US quality [4-6]. Several factors contribute to insufficient US quality, including a high body mass index and the presence of fatty liver [7]. Furthermore, due to the physical properties of the US beam, nearby structures such as the lungs, bowel, and rib cage can hamper the visualization of the liver [4].
In the US Liver Imaging Reporting and Data System (LI-RADS), the technical quality of US for HCC screening or surveillance is assessed using a US visualization score. This score is based on a 3-point scale: A represents no or minimal limitations, B indicates moderate limitations, and C signifies severe limitations [8]. A recent study, based on the analysis of over 10,000 US examinations conducted in the United States, revealed that 24% of the examinations had a visualization score of B, while 4% had a score of C [9]. This finding aligns with a meta-analysis showing that approximately one-quarter of US examinations exhibited limited examination quality [7]. However, in previous studies, the US visualization score has been evaluated by retrospectively reviewing captured images and reports [9-11], which can yield results that differ from those of on-site assessments [12]. Furthermore, even when the US visualization score is evaluated during the examination, inherent limitations exist to estimating the area of the liver that is not visible, due to the absence of a reference standard.
The technique of fusion imaging facilitates the alignment of anatomical coordinates between real-time US and previously acquired computed tomography (CT) or magnetic resonance imaging (MRI) thereby enabling side-by-side visualization of the same area on a monitor [13]. Fusion imaging serves as a valuable tool for guiding liver biopsy or ablation procedures, as it aids in the accurate localization of liver lesions observed on CT or MRI during US examination [14,15]. Since cross-sectional imaging with CT or MRI scans the entire liver, it is anticipated that the CT or MRI images in the fused state can serve as a reference standard for anatomical coverage of the liver during US examination. Consequently, this study was designed to evaluate the quality of US examinations for HCC screening or surveillance using fusion imaging.
Materials and Methods
Compliance with Ethical Standards
This study was approved by the Institutional Review Board of Severance Hospital (IRB No. 4-2022-0783). Written informed consent was obtained from all participants included in the study.
Participants
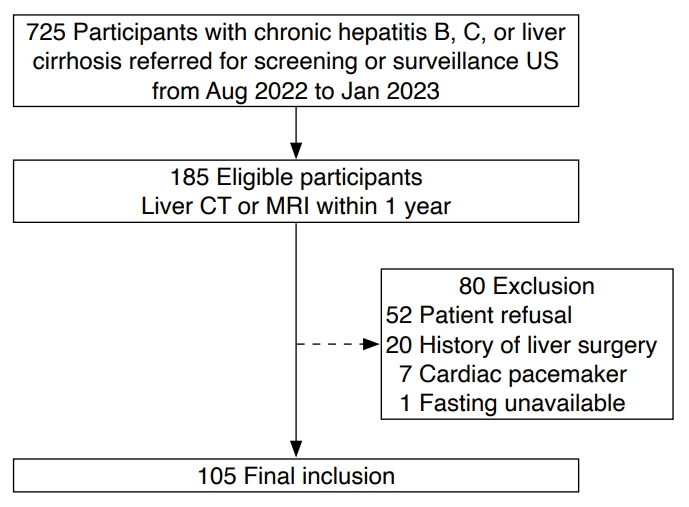
This study consisted of a secondary analysis of a prospectively recruited cohort. Under institutional review board approval, participants with chronic hepatitis B, chronic hepatitis C, or liver cirrhosis, who were referred for screening or surveillance US to the radiology department between August 2022 and January 2023, were screened. Those who had undergone CT or MRI of the entire liver within the past year were considered eligible. Participants were excluded if they declined to undergo additional US with fusion imaging, had a history of liver surgery, had undergone cardiac pacemaker implantation (these patients were excluded to mitigate potential adverse effects of electromagnetic tracking-based image fusion on the cardiac device) [16,17], or were unable to fast.
Fusion US Examination
The liver was examined using fusion imaging, in addition to conventional upper abdominal US, after a minimum fasting period of 6 hours. The fusion US was conducted by a board-certified radiologist (Y.-Y.K., with 4 years of practice experience) using one of the following systems: LOGIQ E9 volume navigation (GE Healthcare, Milwaukee, WI, USA), Aplio i800 Smart Fusion (Canon Medical Systems Corporation, Tokyo, Japan), or EPIQ 5 PercuNav Auto Registration (Philips Healthcare, Eindhoven, The Netherlands). A position sensor was mounted on the convex probe, and point registration was repeatedly performed using vascular or lesion landmarks to reduce misregistration in each hepatic segment.
Using fusion imaging, the operator evaluated several variables at the time of examination. Registration quality was documented based on the following criteria: a score of "excellent" denoted near-perfect registration for both the center and periphery of the liver; "acceptable" indicated successful registration for both the center and periphery, albeit with some misregistration; and "poor" referred to successful registration for the center, but with substantial misregistration for the periphery [18]. The presence and degree of fatty liver were evaluated as follows: "mild" referred to a slight increase in the echogenicity of the liver compared to the normal renal cortex; "moderate" denoted a moderate increase in the liverŌĆÖs echogenicity with mildly impaired visualization of intrahepatic vessels; and "severe" indicated a marked increase in the liverŌĆÖs echogenicity, with poor visualization of the right posterior section parenchyma, intrahepatic vessels, and diaphragm [19]. The echotexture of the liver was classified as either heterogeneous, characterized by the presence of numerous nodules measuring 3 mm or more in the parenchyma, or homogeneous, characterized by a fine parenchymal echo with no such nodules [4]. The US visualization score in LI-RADS was recorded with reference to the fused CT or MRI images as follows: a score of A referred to US quality in which the majority of the liver was well visualized; B denoted US quality in which the liver echogenicity was moderately heterogeneous, or the US beam was moderately attenuated by fatty liver or other structures; and C indicated US quality in which the liver echogenicity was severely heterogeneous, or the US beam was significantly attenuated by fatty liver or other structures, resulting in over 50% of the liver not being visualized [8]. The visualization score of each segment was recorded in the same manner, and anatomical structures limiting visualization of the liver were noted according to the hepatic segment. The scan time for the liver was calculated by subtracting the time of generation of the first image from that of the last image.
In participants who had a focal lesion of 5 mm or larger, as identified on pre-acquired CT or MRI scans, the segment, size, and nature of the index lesion were recorded by a second-year radiology resident (S.-B.C.) prior to fusion imaging. During the fusion imaging process, the visibility of the lesions and any factors limiting visualization were noted. The US LI-RADS category was also recorded using the following scale: 1, no observation or only a definitively benign observation; 2, an observation of less than 10 mm that was not definitively benign; 3, an observation of 10 mm or larger that was not definitively benign, or the presence of a new tumor in the veins [8].
Conventional US Examination
Conventional US was performed by a radiology resident or radiologist of varying experience levels. For comparison with fusion imaging, the images from the same round of conventional US were retrospectively analyzed by a board-certified radiologist (J.-Y.C., with over 20 years of practice experience). This radiologist determined the US visualization score based on the LI-RADS, without knowledge of the fusion imaging results [8]. The same radiologist also retrospectively recorded the liver scan time in the same manner as with fusion US.
Statistical Analysis
Continuous variables were summarized using either the mean and standard deviation or the median and interquartile range (IQR). These were then compared using the Mann-Whitney U test, depending on the normality of the data. Categorical variables were summarized as counts and percentages and compared using either the chi-square test or the Fisher exact test. The distribution of the US visualization score between conventional and fusion US was compared using the extended McNemar test, with a type I error rate set at 0.05. For a power of 80% and a sample size of 105 pairs, the minimum detectable ratio sum for discordant proportions was 0.10. This corresponds to a low effect size, as determined using the PASS 2022 power analysis and sample size software (version 22.0.1, NCSS LLC, Kaysville, UT, USA) [20]. Multivariable logistic regression analysis was performed to identify factors that were independently associated with a US visualization score of B or C. This was based on variables examined in a previous meta-analysis [7]. A two-sided P-value of less than 0.05 was considered to indicate statistical significance. Analyses were performed using the R package (version 3.6.3, The R Foundation for Statistical Computing, Vienna, Austria).
Results
Participants and US Characteristics
A total of 105 participants (mean age, 59┬▒11 years; 66 men) were enrolled in the study (Table 1, Fig. 1). Most participants were infected with the hepatitis B virus (84.8%). Among the 40 participants with liver cirrhosis, 34 (85.0%) were classified as Child-Pugh A. Fusion imaging was primarily performed using either unenhanced MRI (48.6%) or enhanced CT (45.7%). The previous CT or MRI used for fusion imaging was typically obtained for alternative surveillance (72.4%) or for follow-up on extrahepatic malignancy (19.1%). In addition to the approximately 2 minutes required for image fusion between real-time US and pre-acquired CT/MRI, the median scan time for fusion US was 4 minutes (IQR, 3 to 5 minutes), which was longer than that for conventional US (2 minutes [IQR, 2 to 3 minutes]) (P<0.001). Severe fatty liver was a rare occurrence, found in only 1.9% of participants, while 70.5% of participants exhibited a homogeneous echotexture of the liver. The majority of participants, 92.4%, were assigned to US LI-RADS category 1.
US Visualization Score
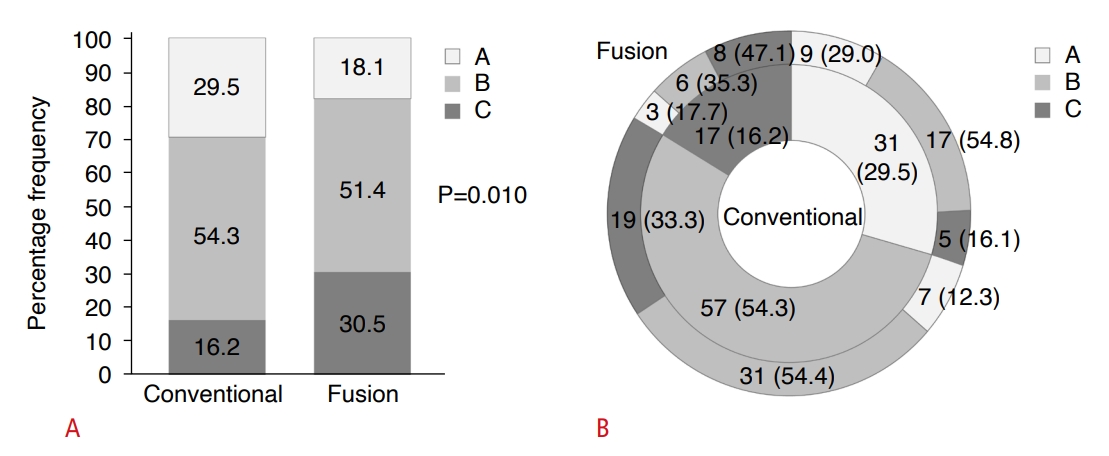
With the conventional US method, US visualization scores of A, B, and C were assigned to 31 (29.5%), 57 (54.3%), and 17 (16.2%) participants, respectively. However, when the fusion imaging techniques of US/MRI (n=54) or US/CT (n=51) were used, scores of A, B, and C were found in 19 (18.1%), 54 (51.4%), and 32 (30.5%) participants, respectively. This difference in score distribution between the two methods was statistically significant (P=0.010) (Fig. 2A). Furthermore, of the participants who received scores of A and B on conventional US, 5 (16.1%) and 19 (33.3%), respectively, were reassigned a score of C when evaluated using fusion imaging (Figs. 2B, 3).
The degree of limitation varied significantly based on the hepatic segment (P<0.001) (Table 2). The segmental visualization scores of B or C were most commonly observed in hepatic segments 7 and 8, followed by segments 5 and 6, and then segments 2 and 3. The score of C was most frequently seen in hepatic segments 7 and 8 (54.3%), primarily due to the lung and ribs. The lung obscured areas of segments 7 and 8 in 86.7% of cases, while the ribs impeded the visualization of various hepatic segments (Fig. 4).
Multivariable logistic regression analysis demonstrated an independent association between male sex and a US visualization score of B or C (adjusted odds ratio, 3.73 [95% confidence interval, 1.30 to 10.76]; P=0.015) (Table 3).
Detection of Focal Liver Lesions Noted on Previously Acquired CT or MRI
Among 60 participants with 109 focal liver lesions (median size, 7 mm [IQR, 5 to 13 mm]), the lesions not detected on fusion US were significantly smaller than those that were detected (median size, 6 mm vs. 8 mm; P=0.005). Of the 31 lesions that were not detected on fusion US, the reason for non-detection was identified as a limited sonic window in 64.5% of cases. This was followed by small lesion size, accounting for 16.1% of non-detections, and fatty liver, which accounted for 12.9% (Table 4).
Discussion
In this secondary analysis of a prospectively recruited cohort, the technical quality of US for HCC screening or surveillance was evaluated based on the US LI-RADS at the time of examination. The anatomical coverage of the liver provided by real-time fusion imaging with pre-acquired CT or MRI, as well as the liver parenchymal echotexture and presence of fatty liver, were considered. Among 105 participants with chronic hepatitis B, chronic hepatitis C, or liver cirrhosis, 51.4% and 30.5% were assigned US visualization scores B and C, respectively, based on fusion imaging. Fusion imaging revealed that 16.1% and 33.3% of participants who initially received US visualization scores of A and B, respectively, on conventional US were reassigned a visualization score of C. This suggests that conventional US may underestimate the limitations of the sonic window.
Several points should be considered in the interpretation of these study results. First, our analysis reveals a significantly different distribution of US visualization scores compared to previous reports, which indicated proportions of scores B and C of 14.4%-24.2% and 2.5%-4.2%, respectively [9,21,22]. In the present study, the proportions of scores of B and C on conventional US were even higher (54.3% and 16.2%, respectively) than those in previous studies focused on patients with liver cirrhosis (27.5% and 28.0%, respectively) or chronic hepatitis B (50% and 1%, respectively) [5,10]. Notably, among the present participants, 72.4% had undergone CT or MRI for alternative surveillance. The quality of surveillance US in prior rounds in these participants may have been deemed inadequate, prompting the use of alternative surveillance methods. This could potentially introduce selection bias [5]. Furthermore, on-site comparison with CT or MRI revealed that a retrospective review of captured images from conventional US may underestimate the areas of the liver that are not visible. It is important to highlight that retrospective evaluation of US quality based on captured images can pose challenges [12]. The use of real-time fusion imaging with CT or MRI as a reference standard for anatomical coverage could potentially offer a more accurate evaluation of US quality following alternative surveillance with CT or MRI.
Male sex was found to be independently associated with US visualization scores of B or C, indicative of inadequate US quality. This finding aligns with previous research [23]. One possible explanation for this association is the higher frequency of rib shadowing in male patients [23], a factor that, in the present study, led to sonic window limitations across nearly all hepatic segments. Previous research has also suggested an association between fatty liver and suboptimal US quality [7]. However, the present study did not corroborate this, potentially due to the limited number of participants with severe fatty liver. Nevertheless, US beam attenuation did hinder the visualization of liver parenchyma or index lesions, which could contribute to suboptimal US quality.
The detectability of focal lesions, as identified on pre-existing CT or MRI scans, was evaluated using fusion imaging to ascertain the potential reasons for their non-detection on US. Notably, most of these lesions were either cysts or hemangiomasŌĆöwhich exhibit different echogenicity from HCC on USŌĆöand were less than a centimeter in size. The most common reason for non-detection on fusion US was the limited sonic window. These findings align with a previous study that demonstrated a lower detectability of lesions when the US visualization score was B or C, as opposed to A [24]. Moreover, the failure to detect HCC during US surveillance was associated with areas of the liver that were not visible [25]. The unseen areas identified in that study, such as the hepatic dome and the subcapsular area beneath the ribs, coincide with the locations assigned with segmental visualization scores of B and C in the present study. Consequently, areas obscured by the lung or ribs should be examined carefully during US surveillance.
Several studies have indicated that alternative imaging modalities, such as CT or MRI, may effectively increase detection sensitivity during HCC surveillance [26-28]. While a longitudinal follow-up study of these participants has not yet been conducted, the use of fusion imaging could assist in identifying patients who might benefit from alternative surveillance due to insufficient US quality. For patients who are undergoing alternative surveillance with gadoxetic acid-enhanced MRI, the application of US/MRI fusion could be beneficial in monitoring MRI-identified hepatobiliary phase hypointense nodules, which carry a high risk of progressing to advanced HCC [29]. Future studies are warranted to validate these concepts.
This study does present several limitations. First, the requirement for prior CT or MRI scans as an eligibility criterion may have led to selection bias. As previously noted, participants with substandard US quality may have been overrepresented. Second, interobserver variability could not be assessed for US visualization scoring, as only one operator performed the fusion imaging. It is also possible that the US visualization score may change dynamically; further research is necessary to validate the findings. Third, operator experience with conventional US could vary, leading to inconsistencies in the acquisition of US images. This could potentially affect the comparison with fusion imaging. Fourth, this study did not account for changes in patient position, such as a semi-erect position, which is used to improve visualization of the entire liver [30]. Given the technical difficulties of applying fusion imaging in various patient positions, this issue may be outside the scope of the present study. Further research is needed to investigate the US visualization score in relation to fusion imaging, taking into account patient position. Finally, the general applicability of the findings may be somewhat restricted due to the predominance of hepatitis B virus infection among the study participants.
In conclusion, the use of real-time fusion imaging, with CT or MRI as the reference standard for anatomical coverage, may provide a more accurate assessment of US quality in HCC surveillance, especially after alternative surveillance methods have been employed.


 Download Citation
 PDF Links
 PubReader
 ePub Link
 Full text via DOI


